HTML Report
On test completion, you will see a web browser window with the generated HTML report.
This report is a convenient way to transfer test results to any interested person.
Note that HTML report is displayed on test completion only
if the option Open HTML report in a browser is turned on
in the Report Options.
WAPT Pro can automatically send HTML report to specified E-mail addresses
on test completion. For this, you should configure the
E-mail settings, then turn on the option
E-mail HTML report to in the Report Options
and specify desired addresses.
By default, HTML reports are saved to the location specified in General
settings
(Save reports files to edit-box). You can select another folder for saving HTML reports.
You can save the generated report
manually to any location. Click the Save Results button
 on the program toolbar and select HTML Files (*.html;*.htm) as file type.
After saving, you will be able to open the report in web browser and view the results.
on the program toolbar and select HTML Files (*.html;*.htm) as file type.
After saving, you will be able to open the report in web browser and view the results.
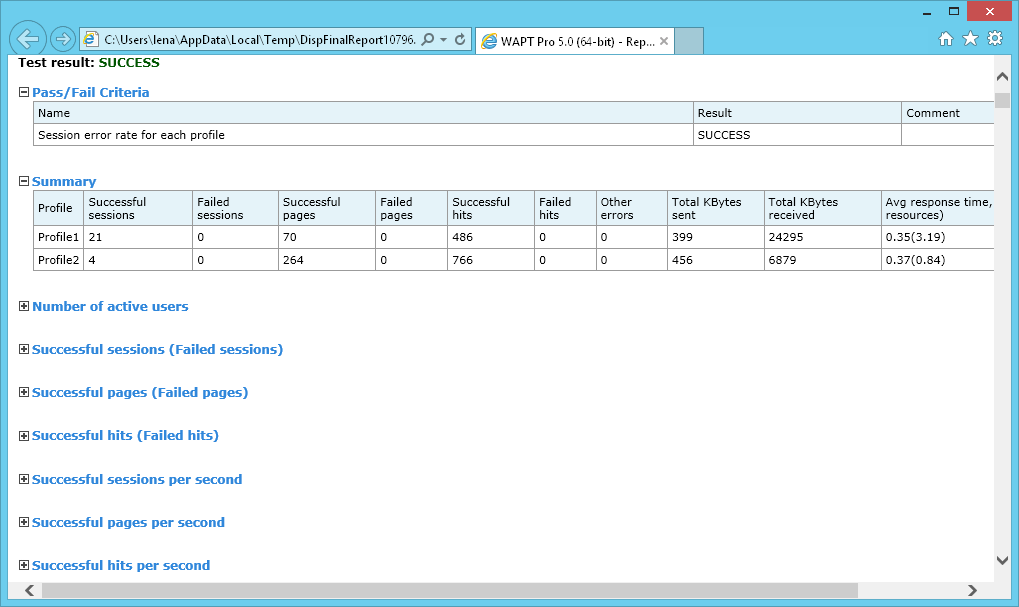
HTML report looks as follows:
Click on a desired title to view the corresponding table of report.
Test execution parameters
This section displays date and time when the test was started and
finished, scenario name, test run comment,
test duration and the number of virtual users participated in the test.
Test executed by: Here you can see the name of computer where WAPT Pro
workplace was running.
Test executed on: Here you can see the names of Load Agents participated in the test run.
Test result
Here you can see the result of test execution: success or failure. It depends on the settings of the Stop Test operator and on the results of passing the pass/fail criteria specified for the current test.
- If the option "Assign the "failure" status to the test independently from the pass/fail criteria" is set in the settings of the Stop Test operator, then the test gets the status "failure" when this operator stops the test. If this option is not set, then the status "success" or "failure" depends on the results of passing the pass/fail criteria.
- Your test passes if all pass/fail criteria are met. Otherwise, if at least one criterion fails, the whole test also fails.
Pass/Fail Criteria
This table shows all pass/fail criteria specified for the current test and the result of their execution: success or failure.
Summary
This table shows the summary information for virtual user profiles participated in
the test.
Successful sessions: Shows the number of successful user sessions (executed without errors)
for each profile.
Failed sessions: Shows the number of sessions executed with errors.
Successful pages: Shows the number of successful pages (executed without errors).
Failed pages: Shows the number of pages executed with errors.
Successful hits: Shows the number of successful hits (executed without errors).
Failed hits: Shows the number of hits executed with errors.
Note that a hit is a single request for resource
(page code, image, script, css and so on) sent to the server, while each page usually includes many hits
(main page request and requests for page resources). The number of pages in reports is the number of
main page requests.
Other errors: Shows the number of JavaScript errors, errors generated by the operators
Stop Session, Stop User, Stop Test and some others.
Total KBytes sent: Shows the total amount of KBytes sent to the server during
test run for each profile.
Total KBytes received: Shows the total amount of KBytes received from the server during
test run for each profile.
Data unit (KBytes, MBytes or GBytes) is specified in the Report Options.
Avg response time, sec (with page resources): Shows values of average response time. The first value is the
response time without page resources, and the second value (in brackets) is the response time
with page resources.
The following tables show various characteristics measured during test run. The whole test duration interval is divided into the number of intervals equal to the Number of columns in tables value. The program calculates the averaged data on each interval and shows it in report.
Number of active users
This table shows the number of active users at the specified periods of time for each profile.
Successful sessions (Failed sessions)
This table shows the number of successful and failed user sessions.
Successful pages (Failed pages)
This table shows the number of successful and failed pages.
Successful hits (Failed hits)
This table shows the number of successful and failed hits.
Successful sessions per second
This table shows the number of sessions executed without errors per time unit (second, minute or hour). Time unit is specified in the Report Options.
Successful pages per second
This table shows the number of pages executed without errors per time unit (second, minute or hour).
Successful hits per second
This table shows the number of hits executed without errors per time unit (second, minute or hour).
Response time, sec (with page resources)
This table shows values of response time
without/with page resources
for each request at various time intervals of test run.
You can see the minimum (Min), maximum (Max), average (Avg) and
Avg80-99 values of response time for each request, as well as
the performance degradation factor (PDF).
Performance degradation factor is a ratio of the response time to the baseline time for each request.
It shows the degradation of performance under load.
In the Report Options view you can adjust the report appearance - you can
define what time values (minimum, maximum, average) will be shown in the reports.
There are two values of response time in each cell: without page resources and including page resources (the last is shown in brackets).
Next to the name of each request you can see how many times it was processed at the specified periods of time.
For details, see the Response Time topic.
Task times calculated as a sum of all response times (values in parenthesis include page resources), sec
This table shows the time of processing of various tasks that you added to user profiles.
It corresponds to tasks calculated as a sum of all response times.
In the table you can see the minimum (Min), maximum (Max), average (Avg) and
Avg80-99 values of task time. There are two values of time in each cell:
without page resources and including page resources (the last is shown in parenthesis).
Also you can see the performance degradation factor (PDF) calculated for the whole task for the specified periods of time.
Next to the name of each task you can see how many times it was processed. It is
the number of completed tasks. A task is considered completed if all its
resources were completed.
Task times calculated as full execution times, sec
This table shows the task times for tasks calculated as full execution times.
In the table you can see the minimum (Min), maximum (Max), average (Avg) and
Avg80-99 values of task time.
Also you can see the performance degradation factor (PDF) calculated for the whole task for the specified periods of time.
Next to the name of each task you can see how many times it was processed.
Performance degradation factor
This table shows the response time degradation factor for each profile of current scenario. To calculate the degradation factor for the whole profile, WAPT Pro takes the values of response time degradation factor for each request of that profile and calculates the root-mean-square value.
KBytes sent
This table shows how many KBytes were sent to the server at the specified periods of time. Data unit (KBytes, MBytes or GBytes) is specified in the Report Options.
KBytes received
This table shows how many KBytes were received from the server at the specified periods of time. Data unit (KBytes, MBytes or GBytes) is specified in the Report Options.
Sending speed, kbit/s
This table shows how many kbits per second were sent to the server. Data unit (kbit/s, Mbit/s or Gbit/s) is specified in the Report Options.
Receiving speed, kbit/s
This table shows how many kbits per second were received from the server. Data unit (kbit/s, Mbit/s or Gbit/s) is specified in the Report Options.
Sending per user speed, kbit/s
This table shows the sending speed per virtual user. Data unit (kbit/s, Mbit/s or Gbit/s) is specified in the Report Options.
Receiving per user speed, kbit/s
This table shows the receiving speed per virtual user. Data unit (kbit/s, Mbit/s or Gbit/s) is specified in the Report Options.
Transferred Data, KBytes
This table shows how many KBytes were transferred at the specified periods of time for different types of requests: HTTP/1.1 page requests and resources, HTTP/2 page requests and resources, HTTP/1.1 and HTTP/2 streaming and WebSockets. Data unit (KBytes, MBytes or GBytes) is specified in the Report Options.
Failed sessions
This table shows the number of sessions executed with errors.
Failed pages
This table shows the number of pages executed with errors.
Failed hits
This table shows the number of hits executed with errors.
Response codes
This table shows response codes for each request in the test sequence. Here you can read the detailed description of response codes.
HTTP errors on pages (hits) as a % of all completed pages (hits)
This table shows the percentage of responses with HTTP errors from the total number of completed pages (hits).
Network errors on pages (hits) as a % of all completed pages (hits)
This table shows the percentage of responses with network errors from the total number of completed pages (hits).
Timeouts on pages (hits) as a % of all completed pages (hits)
This table shows the percentage of timeouts from the total number of completed pages (hits).
You can change the default timeout value in program settings.
Validation errors on pages as a % of all completed pages
This table shows the percentage of validation errors from the total number of completed pages.
Validation errors may appear if you specify validation rules
in profile or request properties. There are several types of validation errors:
• "Response body validation error" and
• "Response time validation error".
Total errors on pages (hits) as a % of all completed pages (hits)
This table shows the percentage of all responses with errors from the total number of completed pages (hits).
Other errors
This table shows the number of JavaScript errors (these are the errors of JavaScript operators and functions included in your profiles), errors generated by the operators Stop Session, Stop User, Stop Test and some others.
Performance counters
This table shows values measured by performance counters for the target web server or database server.
Load agent utilization, %
This table shows values of CPU, memory and network utilization for Load Agents participated in the test run.
Memory utilization is represented by 2 values. The first value is the amount of used memory in megabytes (Mb).
The second value (in brackets) is the percentage of memory utilization. This value (%) is calculated in different way
for 32-bit and 64-bit agents (read more...).
If the utilization of some resource reaches 80% (warning level), the corresponding line is highlighted in yellow.
If the utilization reaches 98% (overload level), the corresponding line is highlighted in red.
Columns in other tables of reports will be also highlighted in yellow (red) in this case. It may signal that
current configuration is not sufficient to produce the desired test load. Test results that you see in such columns may
be not reliable.
![]()