Errors Report
Errors Report shows the
information about errors occurred during test run.
![]() HTTP error:
If you receive an HTTP error, it means that there are problems with the work of web server.
HTTP error:
If you receive an HTTP error, it means that there are problems with the work of web server.
![]() Network error:
Network error indicates bad connectivity and problems with the data transfer.
Network error:
Network error indicates bad connectivity and problems with the data transfer.
![]() Timeout:
If the time of waiting for server operation exceeds the maximum value specified in
General settings, you will receive a timeout.
Timeout:
If the time of waiting for server operation exceeds the maximum value specified in
General settings, you will receive a timeout.
Click on the Errors Report subfolder of Summary Report folder in the Navigation Pane to display the
report.
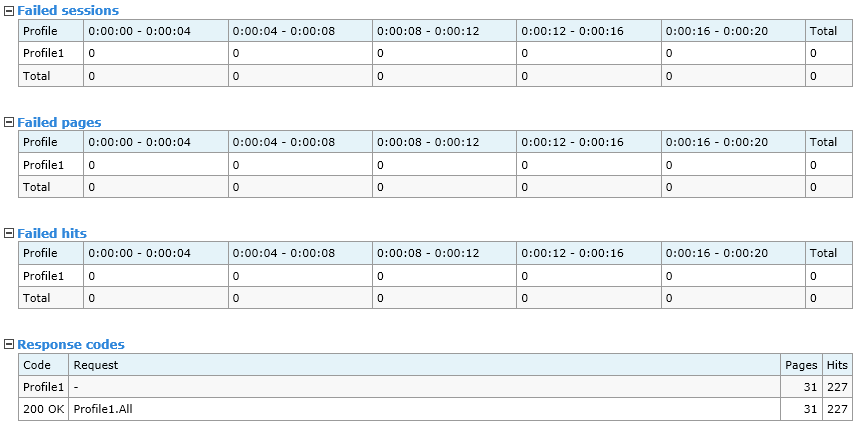
Failed sessions
This table shows the number of sessions executed with errors.
Failed pages
This table shows the number of pages executed with errors.
Failed hits
This table shows the number of hits executed with errors.
Response codes
This table shows response codes for each request in test sequence.
The first digit of response code defines the class of response:
![]() 2xx: Success - The action
was successfully received, understood, and accepted.
2xx: Success - The action
was successfully received, understood, and accepted.
For example, "200 OK".
![]() 3xx: Redirection - Further
action must be taken in order to complete page request.
3xx: Redirection - Further
action must be taken in order to complete page request.
For example, "302 Found", "304 Not Modified".
![]() 4xx: Client Error - Page
request contains bad syntax or cannot be fulfilled.
4xx: Client Error - Page
request contains bad syntax or cannot be fulfilled.
For example, "403 Forbidden", "404 Not found", "407 Proxy Authentication Required".
You can also receive the response code "401 Authorization Required" - it is authorization request.
![]() 5xx: Server Error - Server
failed to fulfil an apparently valid page request.
5xx: Server Error - Server
failed to fulfil an apparently valid page request.
For example, "500 Internal server error".
Besides you can see the following errors:
![]() "From cache" - Information was cached during the test and then taken from cache.
"From cache" - Information was cached during the test and then taken from cache.
![]() "HTTP Protocol violation" - The structure of server response violates the rules of HTTP protocol and
response cannot be parsed correctly.
"HTTP Protocol violation" - The structure of server response violates the rules of HTTP protocol and
response cannot be parsed correctly.
![]() "Timeout" - If the time of waiting for server operation exceeds the value specified in
"General" settings, you will receive a timeout.
"Timeout" - If the time of waiting for server operation exceeds the value specified in
"General" settings, you will receive a timeout.
![]() "Network error" - Problems with the network connection.
"Network error" - Problems with the network connection.
![]() "Unknown" - Unknown error.
"Unknown" - Unknown error.
If a web page includes images, CSS, JavaScript and other resources, they can receive different response codes
during the test. In this case you will see different response codes for the same page in the table.
Using the "Response codes" table,
you can see what requests were executed with errors and what type of error it was.
Then you can find problem pages in the log to examine server responses in more detail.
Pages column shows how many times the main page request was executed.
Hits column shows the number of hits executed for each request/profile.
HTTP errors on pages (hits) as a % of all completed pages (hits)
This table shows the percentage of responses with HTTP errors from the total number of completed pages (hits).
Network errors on pages (hits) as a % of all completed pages (hits)
This table shows the percentage of responses with network errors from the total number of completed pages (hits).
Timeouts on pages (hits) as a % of all completed pages (hits)
This table shows the percentage of timeouts from the total number of completed pages (hits).
Validation errors on pages (hits) as a % of all completed pages (hits)
This table shows the percentage of validation errors from the total number of completed pages (hits).
Validation errors may appear if you specify validation rules
in profile or request properties. There are several types of validation errors:
![]() "Response body validation error" or
"Response body validation error" or
![]() "Response time validation error".
"Response time validation error".
Total errors on pages (hits) as a % of all completed pages (hits)
This table shows the percentage of all responses with errors from the total number of completed pages (hits).
Other errors
This table shows the number of JavaScript errors (these are the errors of JavaScript operators and functions included in your profiles), errors generated by the operators Stop Session, Stop User, Stop Test and some others.
![]()