Summary Report
Summary Report represents the
consolidated information on test run execution.
You can view the Summary Report on test completion to know how tests were performed.
You can also view intermediate results at run-time while your test is being executed.
Click on the Summary Report folder in the Navigation Pane to display the report.
Test execution parameters
This section displays date and time when the test was started and
finished, scenario name, test run comment,
test duration and the number of virtual users participated in the test.
Test executed by: Here you can see the name of computer where WAPT Pro
workplace was running.
Test executed on: Here you can see the names of Load Agents participated in the test run.
Test result
Here you can see the result of test execution: success or failure. It depends on the settings of the Stop Test operator and on the results of passing the pass/fail criteria specified for the current test.
- If the option "Assign the "failure" status to the test independently from the pass/fail criteria" is set in the settings of the Stop Test operator, then the test gets the status "failure" when this operator stops the test. If this option is not set, then the status "success" or "failure" depends on the results of passing the pass/fail criteria.
- Your test passes if all pass/fail criteria are met. Otherwise, if at least one criterion fails, the whole test also fails.
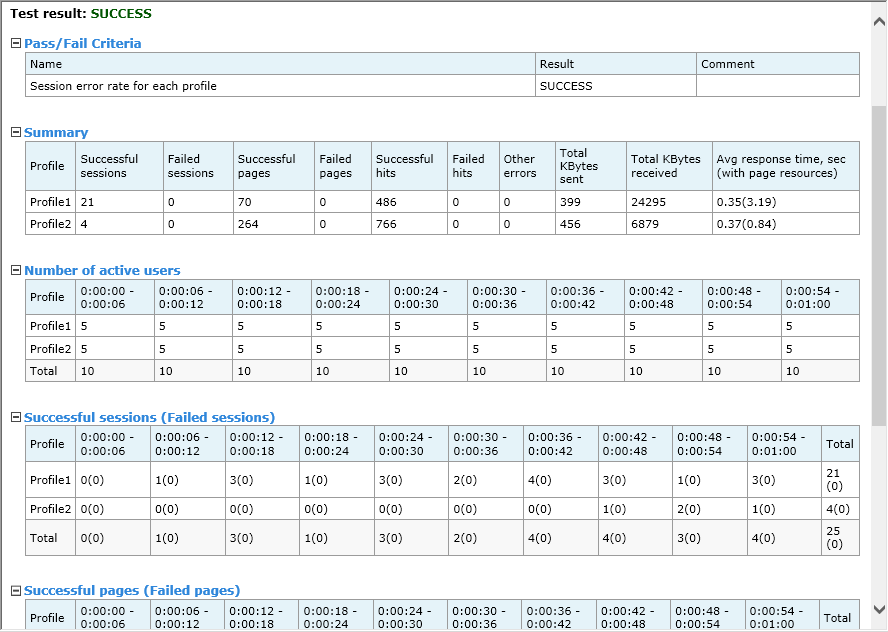
Pass/Fail Criteria
This table shows all pass/fail criteria specified for the current test and the result of their execution: success or failure.
Summary
This table shows the summary information for virtual user profiles participated in
the test.
Successful sessions: Shows the number of successful user sessions (executed without errors)
for each profile.
Failed sessions: Shows the number of sessions executed with errors.
Successful pages: Shows the number of successful pages (executed without errors).
Failed pages: Shows the number of pages executed with errors.
Successful hits: Shows the number of successful hits (executed without errors).
Failed hits: Shows the number of hits executed with errors.
Note that a hit is a single request for resource
(page code, image, script, css and so on) sent to the server, while each page usually includes many hits
(main page request and requests for page resources). The number of pages in reports is the number of
main page requests.
Other errors: Shows the number of JavaScript errors, errors generated by the operators
Stop Session, Stop User, Stop Test and some others.
Total KBytes sent: Shows the total amount of KBytes sent to the server during
test run for each profile.
Total KBytes received: Shows the total amount of KBytes received from the server during
test run for each profile.
Data unit (KBytes, MBytes or GBytes) is specified in the Report Options.
Avg response time, sec (with page resources): Shows values of average response time. The first value is the
response time without page resources, and the second value (in brackets) is the response time
with page resources.
Number of active users
This table shows the number of active users at the specified periods of time for each profile.
Successful sessions (Failed sessions)
This table shows the number of successful and failed user sessions.
Successful pages (Failed pages)
This table shows the number of successful and failed pages.
Successful hits (Failed hits)
This table shows the number of successful and failed hits.
Saving the Summary Report
You can save the Summary Report as HTML file in required location.
Right-click on the displayed
report and select the Save Current Report to HTML... option on the context menu.
You will be able to view this report
later, at any time you wish just from a web browser.
You can also view the following reports:
![]() Performance Data
Performance Data
![]() Response Time
Response Time
![]() Bandwidth Usage
Bandwidth Usage
![]() Errors Report
Errors Report
![]()