Performance Data
The most valuable result of testing site/application capacity and overall performance is the
number of pages/hits per second that it can serve under different user load.
Note that a hit is a single request for resource (page code, image, script and so on) sent to
the server, while each page usually includes many hits (main page request and requests for page resources).
Performance Data report contains the
information on the level of performance: the number of successfully executed sessions/pages/hits
per time unit.
Click on the Performance Data subfolder of Summary Report folder in the Navigation Pane to display the
report.
Note:
Time unit (second, minute or hour) used in this report is specified in the Report Options.
You can change the time unit and click the Update report and graphs button in the Report Options.
Current report will be updated using the new time unit.
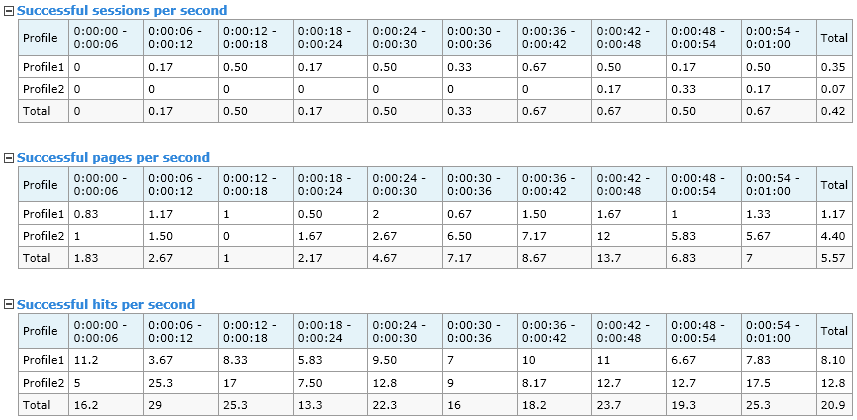
Successful sessions per second
This table shows the number of sessions executed without errors per time unit (second, minute or hour).
Successful pages per second
This table shows the number of pages executed without errors per time unit (second, minute or hour).
Successful hits per second
This table shows the number of hits executed without errors per time unit (second, minute or hour).
Load Agent utilization, %
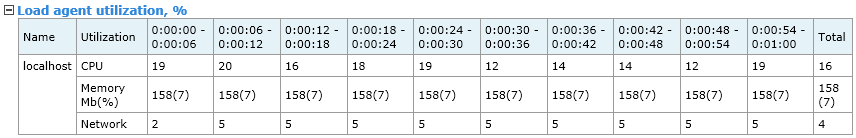
This table shows values of CPU, memory and network utilization for Load Agents participated in the test run.
Memory utilization is represented by 2 values. The first value is the amount of used memory in megabytes (Mb).
The second value (in brackets) is the percentage of memory utilization. This value (%) is calculated in different way
for 32-bit and 64-bit agents.
For example, if V is virtual memory and P - physical memory (hardware), then the percentage of memory
utilization is calculated according to the following formulas:
![]() (V / MIN(2Gb, P)) *100% for 32-bit agent
(V / MIN(2Gb, P)) *100% for 32-bit agent
![]() (V / P) *100% for 64-bit agent
(V / P) *100% for 64-bit agent
If the utilization of some resource reaches 80% (warning level), the corresponding line is highlighted in yellow.
If the utilization reaches 98% (overload level), the corresponding line is highlighted in red.
Columns in other tables of reports will be also highlighted in yellow (red) in this case. It may signal that current
configuration is not sufficient to produce the desired test load. Test results that you see in such columns may be not reliable.
Performance counters
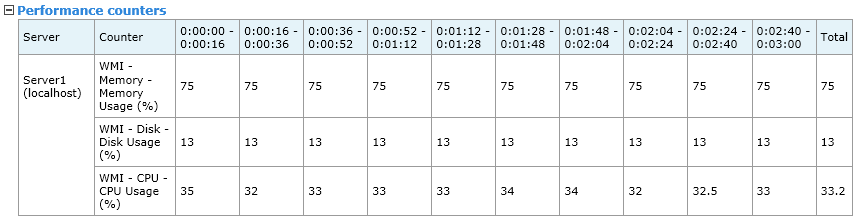
This table shows values measured by performance counters for the target web server or database server.
![]()