Response Time
Response Time report represents the values of
server response time.
Average and maximum response times are the most important characteristics of load testing.
They tell you how long a user waits for server response to his request.
You should ensure that users of your site/application get the response in acceptable time.
There are 3 important limits for response time values:
![]() 0.1 second.
It is an ideal response time. Users feel that the system is reacting instantaneously, and do not
sense any interruption.
0.1 second.
It is an ideal response time. Users feel that the system is reacting instantaneously, and do not
sense any interruption.
![]() 1.0 second.
It is the highest acceptable response time. Users still do not feel an interruption, though they
will notice the delay. Response times above 1 second interrupt user experience.
1.0 second.
It is the highest acceptable response time. Users still do not feel an interruption, though they
will notice the delay. Response times above 1 second interrupt user experience.
![]() 10 seconds.
It is the limit after which response time becomes unacceptable. Moreover, recent studies show
that if response time exceeds 8 seconds, user experience is interrupted very much and most
users will leave the site or system.
10 seconds.
It is the limit after which response time becomes unacceptable. Moreover, recent studies show
that if response time exceeds 8 seconds, user experience is interrupted very much and most
users will leave the site or system.
Normally, response times should be as fast as possible. The interval of most comfortable
response times is 0.1 - 1 second. Although people can adapt to slower response times, they are
generally dissatisfied with the times longer than 2 seconds.
Click on the Response Time subfolder of Summary Report folder in the Navigation Pane to view
the Response Time report.
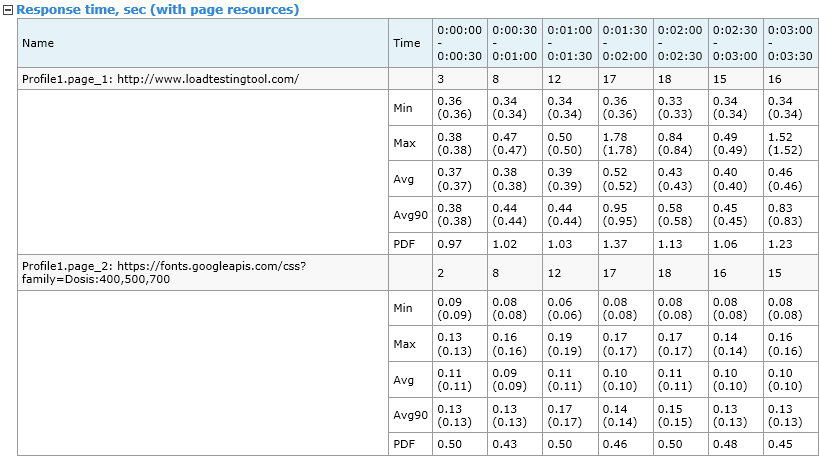
You can see the minimum (Min), maximum (Max), average (Avg) and
Avg80-99 values of response time for each request, as well as
the performance degradation factor (PDF).
Performance degradation factor is a ratio of the response time to the baseline time for each request.
It shows the degradation of performance under load.
There are two values of response time in each cell: without page resources and including page resources (the last is shown in brackets).
Next to the name of each request you can see how many times it was processed at the specified periods of time.
If some column in the table is empty, it means that request was not executed during a period specified in column header. Decrease the Number of columns in tables value in the Report Options. Time intervals represented in column headers will become longer. Run the test again to verify that you get correct results. In the Report Options view you can also adjust the report appearance - you can define what time values (minimum, maximum, average) will be shown in the reports.
Task times calculated as a sum of all response times (values in parenthesis include page resources), sec
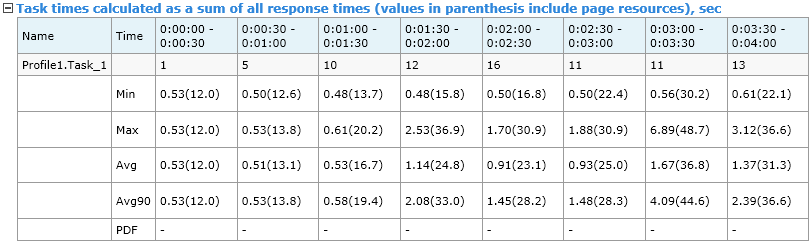
This table shows the time of processing of various tasks that you added to user profiles.
It corresponds to tasks calculated as a sum of all response times.
In the table you can see the minimum (Min), maximum (Max), average (Avg) and
Avg80-99 values of task time. There are two values of time in each cell:
without page resources and including page resources (the last is shown in parenthesis).
Also you can see the performance degradation factor (PDF) calculated for the whole task for the specified periods of time.
Next to the name of each task you can see how many times it was processed. It is
the number of completed tasks. A task is considered completed if all its
resources were completed.
Task times calculated as full execution times, sec
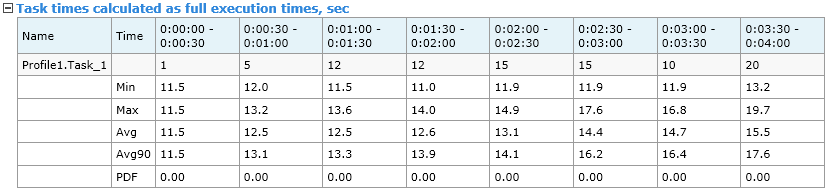
This table shows the task times for tasks calculated as full execution times.
In the table you can see the minimum (Min), maximum (Max), average (Avg) and
Avg80-99 values of task time.
Also you can see the performance degradation factor (PDF) calculated for the whole task for the specified periods of time.
Next to the name of each task you can see how many times it was processed.
Performance degradation factor

This table shows the response time degradation factor for each profile of current scenario.
To calculate the degradation factor for the whole profile, WAPT Pro
takes the values of response time degradation factor for each request of that profile and
calculates the root-mean-square value.
![]()