Collecting Performance Counters Statistics
When you test a web server and something goes wrong, you want to find the source of the problem. To investigate
the problem, it is necessary to monitor the key performance
parameters of a tested web server such as the load
on processor (CPU utilization), percentage of used memory and used disk space,
server network interfaces speed and others.
Besides, if your web server sends requests to some database server, you can also monitor the performance
of database server. This is done by sending special SQL requests to the database through the ODBC interface.
WAPT Pro
supports monitoring of 3 types of database servers: MS SQL, Oracle and MySQL.
WAPT Pro can monitor the performance
of different components of your web application, the performance of web and SQL servers during the test.
Monitoring is made by means of SNMP (Simple Network Management Protocol), WMI (Windows Management Instrumentation),
HTTP protocol for Apache performance monitoring and ODBC interface for database servers.
![]() WMI is used for
monitoring of the system resources (such as CPU/memory/disk usage, network interfaces speed and others) and
for monitoring of IIS web servers, Microsoft SQL servers and Microsoft .NET applications. This protocol works
on Windows systems.
WMI is used for
monitoring of the system resources (such as CPU/memory/disk usage, network interfaces speed and others) and
for monitoring of IIS web servers, Microsoft SQL servers and Microsoft .NET applications. This protocol works
on Windows systems.
![]() SNMP protocol can be used for
monitoring of the system resources on various systems: Windows, Unix, Linux and others.
SNMP protocol can be used for
monitoring of the system resources on various systems: Windows, Unix, Linux and others.
![]() Apache server monitoring is made
via the HTTP protocol.
Apache server monitoring is made
via the HTTP protocol.
![]() ODBC interface is used
for monitoring of the database servers: MS SQL, Oracle and MySQL.
ODBC interface is used
for monitoring of the database servers: MS SQL, Oracle and MySQL.
SQL performance counters retrieve database performance values directly from the database. The access to the server
is done through the ODBC. So, in order to use these counters you need to setup an ODBC connection to your database
and specify its name in the counter properties.
WAPT Pro has a set of predefined counters. You can add your own counters for your application, web server or
database using the supported protocols (WMI, SNMP, Apache or ODBC). Each counter is implemented with the help of
a JavaScript code that uses
special functions
to retrieve the performance values. You can use the implementation of
the predefined counters as an example and add your own ones in a similar way.
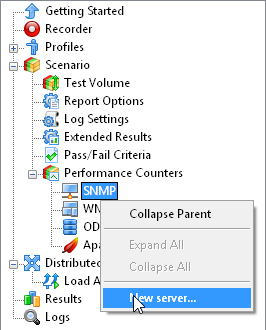
Switch to the Performance Counters view where you can add servers for monitoring.
SNMP-monitoring
Right-click the SNMP item in the tree view and select New server
to add a new server for SNMP-monitoring.
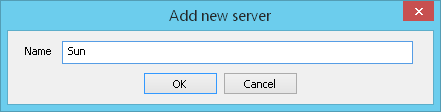
Enter the server name and click "OK":
Specify the settings of the new server:
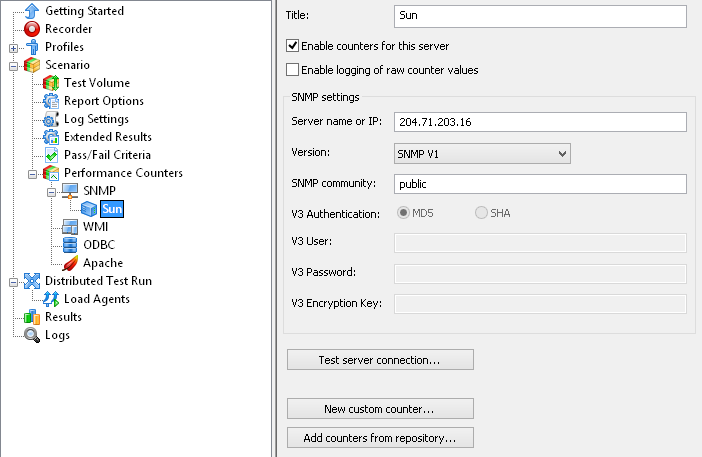
Title: Enter the title of a server being tested. This title will be displayed in the tree view.
Enable counters for this server: This option enables/disables counters for this server during the test run.
Enable logging of raw counter values: This option allows generating a log file which contains information about the work of
performance counters. It is saved on the computer running WAPT Pro
in the "Users\[username]\Documents\My WAPT Pro\Logs\Temp_\Performance Counters Logs" folder.
Besides, a file "ScenarioName--date-time-timing-performance-counters-raw-data.csv" is generated;
it keeps all data gathered by performance counters during the test.
It is stored together with all other CSV files.
Server name or IP: Enter the name of a target server or its IP address.
Version: Select the version of SNMP: V1, V2c or V3.
![]() For SNMP V1 and V2c you should enter the name of some
SNMP community. SNMP default community is "public".
For SNMP V1 and V2c you should enter the name of some
SNMP community. SNMP default community is "public".
![]() For SNMP V3 you should specify a username and password
for authorization and select the type of authentication: MD5 or SHA.
For SNMP V3 you should specify a username and password
for authorization and select the type of authentication: MD5 or SHA.
Test server connection: Using this button you can test the settings you have just specified.
If all settings are correct, you will see a message saying that everything is "OK".
Otherwise, if the program is unable to establish a connection to the target server (e.g. if you specified the
wrong settings or there are connectivity problems), you will see the corresponding error message.
New custom counter: Adds a new custom counter for the current server.
You can enter the value of polling interval for this counter (an interval between probes) and the JavaScript code that will be executed.
Add counters from repository: Opens a special dialog for adding counters from repository.
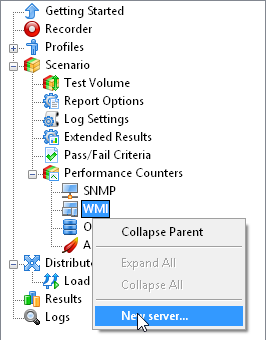
WMI-monitoring
Right-click the WMI item in the tree view and select New server
to add a new server for WMI-monitoring.
Specify the settings of the new server:
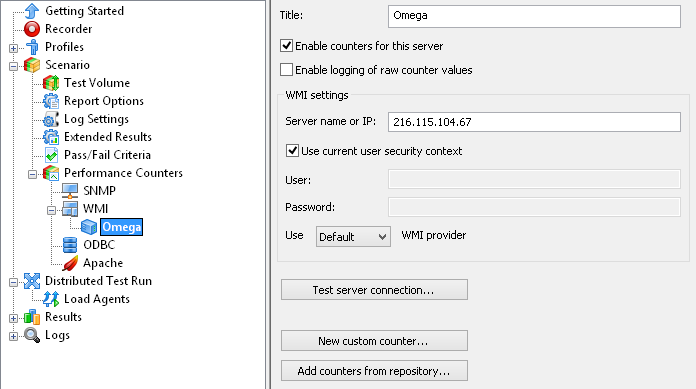
For WMI server you should specify a username and password for authorization. Or you can check the option
Use current user security context to use the logon information of the currently logged on user.
Usually the default WMI provider is sufficient for all counters on 32-bit and 64-bit systems. However if
you need to use specific counters available only on 64-bit systems, select the option Use x64 WMI provider.
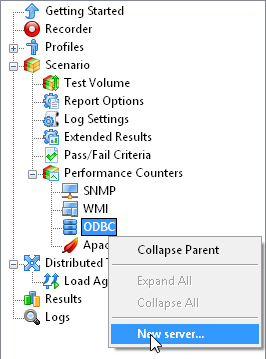
ODBC-monitoring
Right-click the ODBC item in the tree view and select New server
to add a new database server for monitoring.
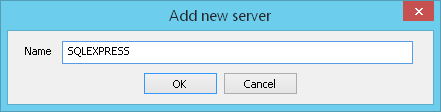
Enter the server name and click "OK":
Specify the settings of the new server:
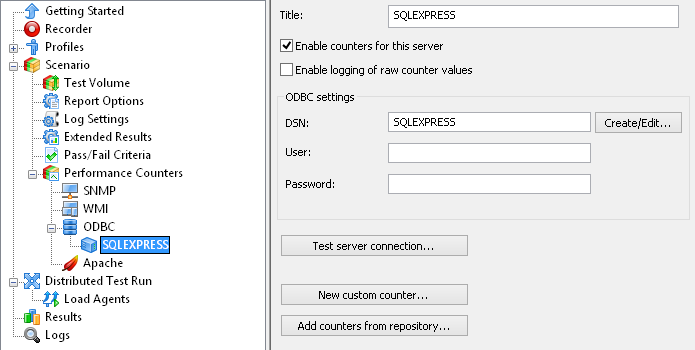
Title: Enter the title of a target server. This title will be displayed in the tree view.
Enable counters for this server: This option enables/disables counters for this server during the test run.
Enable logging of raw counter values: This option allows generating a log file which contains information about the work of
performance counters. It is saved on the computer running WAPT Pro
in the "Users\[username]\Documents\My WAPT Pro\Logs\Temp_\Performance Counters Logs" folder.
Besides, a file "ScenarioName--date-time-timing-performance-counters-raw-data.csv" is generated;
it keeps all data gathered by performance counters during the test.
It is stored together with all other CSV files.
DSN: Here you should specify a Data Source Name (DSN) - a name used for establishing a connection with a database
server via ODBC. Click the "Create/Edit" button to open the "ODBC Data Source Administrator (32-bit)" dialog:
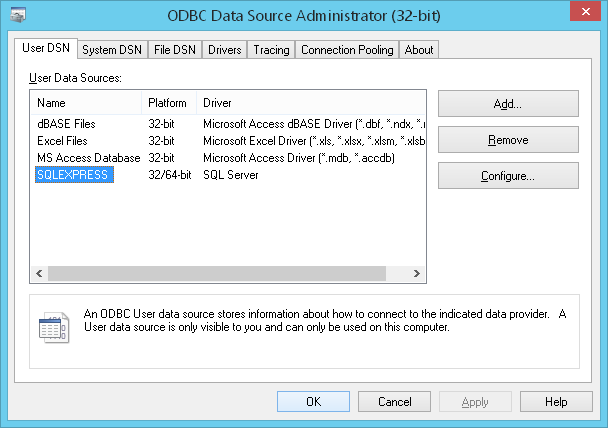
Here you can add the necessary Data Source using the "Add" button. Then close this dialog and
enter the data source name in the "DSN" field of the server properties.
User, Password: Specify a username and password for authorization (if required).
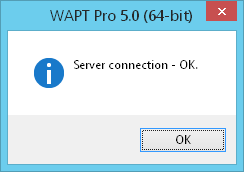
Test server connection:
Database performance parameters are obtained from the database itself through the ODBC interface.
Click this button to test the ODBC connection. In case of successful test you will see such message:
New custom counter: Adds a new custom counter for the current server. You can enter
the value of polling interval for this counter (an interval between probes) and the JavaScript code that will be executed.
Add counters from repository: Opens a special dialog for adding counters from repository.
Apache performance monitoring
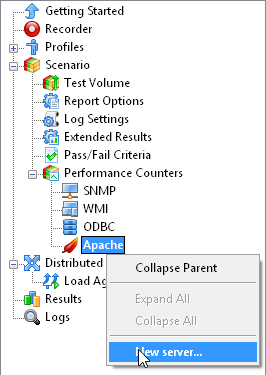
Right-click the Apache item in the tree view and select New server
to add a new Apache server for monitoring.
Specify the settings of the new server:
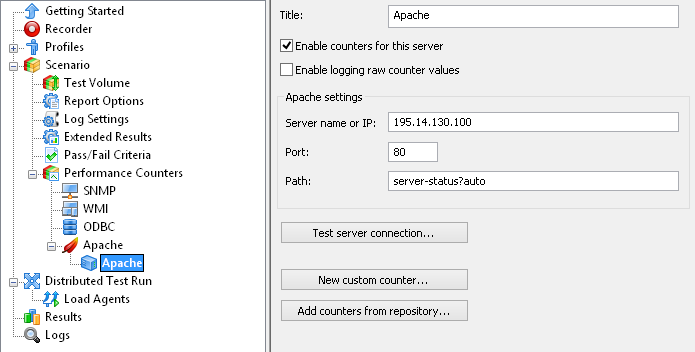
Server name or IP: Enter the name of a tested server or its IP address.
Port: Here you can change the default port number.
Path: Here you should specify a path to a file where the statistics of Apache server is stored.
Adding counters from repository
Basic performance counters are predefined in the program. To use them, you should add the necessary counters from repository.
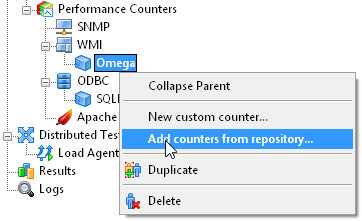
Right-click the server name in the tree view and select Add counters from repository option. Or click the
Add counters from repository button in server properties on the right.
The following dialog will be displayed. Check the necessary counters in the list and click the Add counters button.
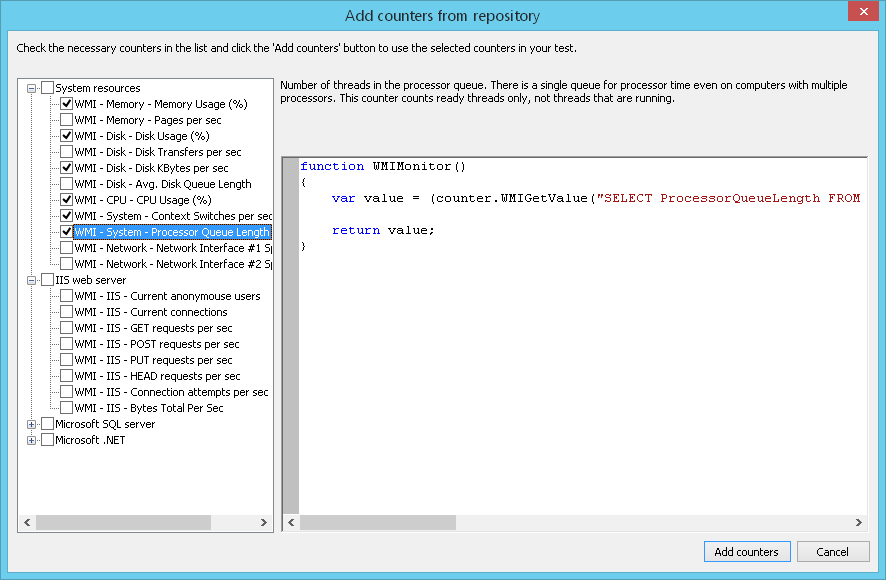
Added counters will appear in the tree view under the name of selected server:
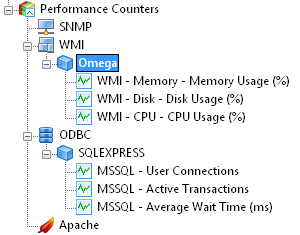
If you click any counter in the tree view, you will see its properties:
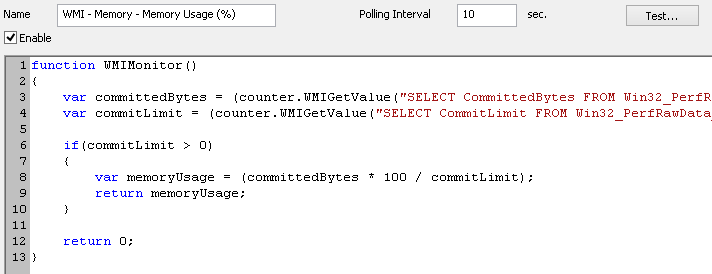
Here you can change counter's name, the value of polling interval and JavaScript code.
The Enable option enables/disables the current counter.
Click the Test button to test the work of performance counter.
You will see values measured by the counter:
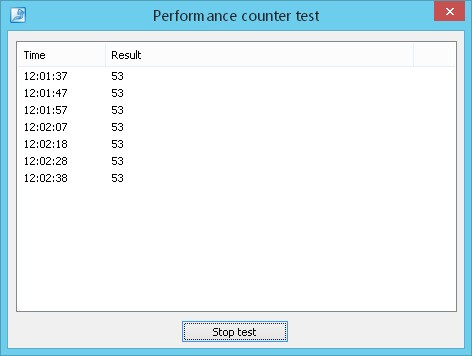
Click the Stop test button to stop the performance counter test.
You can duplicate any counter - make its identical copy. Right-click any counter in the tree view and select the Duplicate option. The duplicated counter appears in the tree view under the name of original counter. You can change its properties.
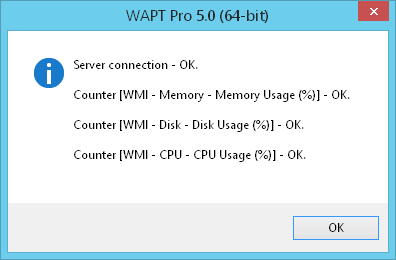
You can test that all performance counters added to your scenario work correctly.
Click on the server name in the tree view and
click the Test button in the server properties on the right.
If all specified settings are correct and the code of counters is compiled without errors,
you will see a message saying that everything is "OK":
Otherwise, if the program is unable to establish a connection to the tested server
(e.g. if you specified the wrong settings or there are connectivity problems), or if there are errors during the
compilation of JavaScript code of performance counters, you will see the corresponding error message.
Adding a new performance counter
You can add your own specific counters for any additional data available in your application, web server or database
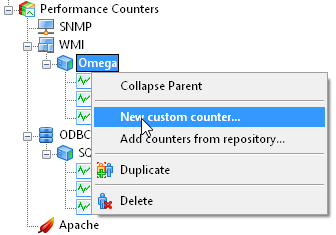
using the supported protocols (WMI, SNMP, Apache or ODBC). Right-click the server name in the tree view and select the
New custom counter option to add a new counter. Or click the New custom counter button
in server properties on the right.
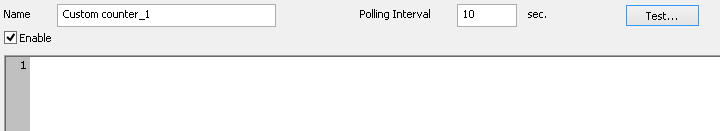
The following dialog will be displayed. Enter the new counter name and click "OK":
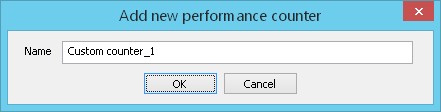
The new counter will be displayed in the tree view under the name of selected server. Now you can enter
the value of polling interval for this counter (an interval between probes) and the
JavaScript code that will be executed:
All performance counters are based on the JavaScript functions.
Here you can
see the description of functions that can be used in the JavaScript code.
Using these functions you can perform any required calculations, e.g.
take the previous value of a counter, calculate the average of several
counter's values, add/subtract values, etc.
To delete some performance counter, select it in the tree view, right-click and select the Delete option.
Importing performance counters from another scenario
WAPT Pro stores performance counters in scenario file (scenario-name.wpsx).
You can import performance counters from another scenario (created in WAPT Pro 4.0/4.3/4.7/5.0).
Click the Import Performance Counters command on the Tools menu
and select the necessary scenario file. In the displayed dialog select the necessary counters
and click the Import button.
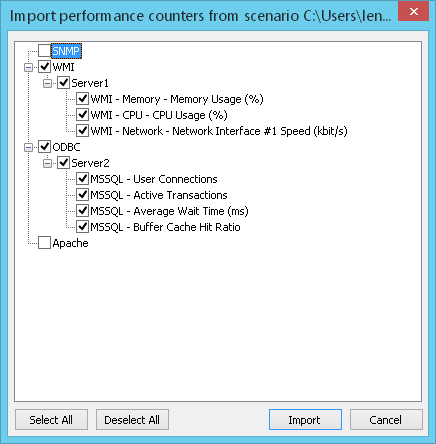
Imported counters will appear in the tree view.
Performance counters in reports and graphs
Values of performance counters are included in generated reports and graphs, so you can see how these parameters were changing during the test. For details see the Performance Data report, HTML Report and Summary Graphs (Performance Counters tab).
Besides, if you check the Save response time statistics option in the Extended Results settings, then values of performance counters will be written to special CSV files:
- ScenarioName--date-time-timing-performance-counters-raw-data.csv
This file stores all data gathered by performance counters during the test. Note that the data is written to this file only if the option "Enable logging of raw counter values" is checked in server settings.
- ScenarioName-Performance Counters on ServerName-date-time.csv
This file represents the averaged data on each interval:
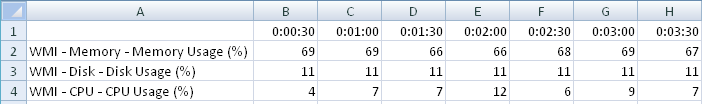
These files are stored together with all other CSV files.
A folder for storage of CSV results is specified in the
General Settings
(Save CSV results to option).
Troubleshooting
Usually MS SQL server statistics is updated automatically and you can monitor the performance of MS SQL server. However, if something goes wrong (e.g. you see that received values are not updated, or they are equal to 0, or you do not receive any values at all), you will need to update the server statistics. This can be done automatically if you create a job in Microsoft SQL Server Management Studio and define the necessary scheduling options. Note that this procedure is required only in case you receive wrong results using the default settings. In the majority of cases you will not face any problems and will not need to create any special jobs.
![]()