Analyzing Test Results
When the test is over, you can view results in the form of text reports
and graphs to know how tests were performed.
![]() HTML
Report: Enables viewing test run results just in
a web browser. On test completion, you will see a web browser window with the generated
HTML Report.
HTML
Report: Enables viewing test run results just in
a web browser. On test completion, you will see a web browser window with the generated
HTML Report.
![]() Summary Report:
Contains a number of text reports that display the
consolidated information on test run execution. Expand the Summary Report folder in the Navigation Pane
to display these reports.
Summary Report:
Contains a number of text reports that display the
consolidated information on test run execution. Expand the Summary Report folder in the Navigation Pane
to display these reports.
![]() Summary
Graphs:
A number of graphs that display the
consolidated information on all requests of all user profiles.
Click on the Summary Graphs item in the Navigation Pane to display the chart.
Summary
Graphs:
A number of graphs that display the
consolidated information on all requests of all user profiles.
Click on the Summary Graphs item in the Navigation Pane to display the chart.
![]() Graphs for User Profiles:
WAPT Pro creates
graphs for all user profiles of test scenario. Click on any
profile in the Results folder of the Navigation Pane and you will see the
corresponding chart. The chart
displays the consolidated information on all requests of selected profile.
These graphs are similar to Summary Graphs.
Graphs for User Profiles:
WAPT Pro creates
graphs for all user profiles of test scenario. Click on any
profile in the Results folder of the Navigation Pane and you will see the
corresponding chart. The chart
displays the consolidated information on all requests of selected profile.
These graphs are similar to Summary Graphs.
![]() Graphs
for Individual Pages:
WAPT Pro
creates graphs for all page requests of test scenario. Click on a desired page request in the
Results folder of the Navigation Pane and you will see the corresponding chart. Any graph for
individual page displays test results measured for that page.
Graphs
for Individual Pages:
WAPT Pro
creates graphs for all page requests of test scenario. Click on a desired page request in the
Results folder of the Navigation Pane and you will see the corresponding chart. Any graph for
individual page displays test results measured for that page.
You can also view intermediate results at run-time while your test is being executed. For this, click
on a desired item in the Navigation Pane while the test is running (in the Results folder of the Navigation Pane).
Saving Test Results
WAPT Pro provides you with several ways to store the results of test run:
![]() HTML
files
HTML
files
By default, the generated HTML Report is saved to the folder specified in
General settings
(Save report files to option). You can specify another folder for saving HTML Reports.
Besides, you can save the HTML Report manually to any desired location. For this,
click the Save Results button  on the program toolbar and select HTML Files (*.html;*.htm)
as file type.
on the program toolbar and select HTML Files (*.html;*.htm)
as file type.
![]() CSV
files
CSV
files
You can adjust WAPT Pro to save test results in CSV format and import them later, at any time you wish
to Microsoft® Excel. Check the Save test results option in the Extended Results settings.
If you check this option, then for each user profile a file with test results will be created. In
General settings you can change the default location for test result files
(Save CSV results to option).
Besides, you can save test results as CSV files manually to any desired location.
Click the Save Results button
on the program toolbar and select CSV (Comma separated values)
(*.csv) as file type.
![]() WAPT Pro
result file
WAPT Pro
result file
You can save generated text reports and the data for graphs as a file with .wpr extension.
It is WAPT Pro extension for test result files. Click
the Save Results button
on the program toolbar and select WAPT Pro Results Files
(*.wpr) as file type. This file will also include the
current test scenario and user profiles.
After saving, you will be able to open this file in WAPT Pro and view
the results
in the form of Summary Report, Summary Graphs and graphs
for all user profiles and individual pages.
To open WAPT Pro result file, click
Open -> Results... button on the program toolbar:
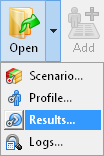 In the displayed dialog, select a desired file and click Open.
In addition,
you can save any report of the Summary Report folder as HTML file in
required location. For this, select a desired report in the Summary Report folder of the Navigation Pane,
right-click on the displayed report in the right pane and select the
Save Current Report to HTML... option on the context
menu. In the displayed dialog, enter file name, select a location and click Save.
You can save any graph as an image in png format
in required location.
For this, select a desired graph in the Navigation Pane,
right-click on the displayed chart and click the Save Current Chart to Image... option on the
context menu.
In the displayed
dialog, enter file name, select a location and click Save.
![]()