CSV Results
You can adjust WAPT Pro to save test results in CSV format. Then you will be able to use any external data management and processing system to work with the CSV results of your load tests.
CSV Results of Test Run
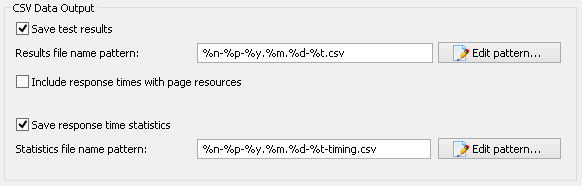
Check the Save test results option in the
Extended Results settings
to save test results in CSV format.
Then for each user profile, a file with test results will be created. The default
location for CSV files is specified in General
settings (Save CSV results to edit-box).
If you have not checked the Save test results option before test run,
you can save test results as CSV files manually after test completion.
Click the Save Results button
 on the program toolbar and select CSV (Comma separated values) (*.csv) as file type.
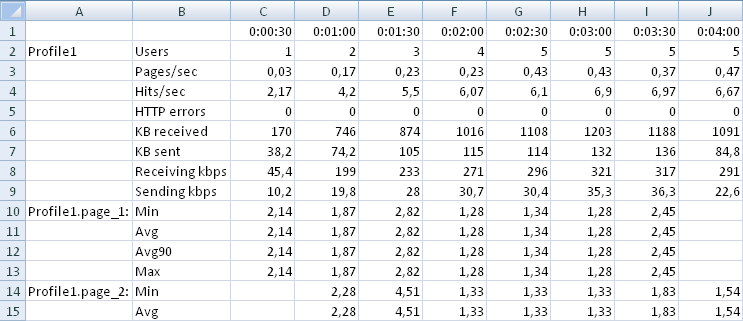
CSV files are raw results of test run.
You can process these results, for example, make graphs in Microsoft® Excel.
CSV files show various characteristics measured during the test run.
The whole test duration interval is divided into the
number of intervals equal to the Number of columns in tables value.
The program calculates the averaged data on each interval and shows it in the result file.
Entries of CSV files are separated by the symbol specified in the
Delimiter for CSV files
combo-box of General settings.
It can be either semicolon, comma, tab or space symbol.
Below you can see an example of CSV file:
Response Time Statistics
WAPT Pro can export the complete time statistics including the timings for each separate request and
response to the CSV file. This is one more type of CSV files - Response Time Statistics.
This file is generated if the option Save response time statistics is checked in
the Extended Results settings.
The default location for these files is specified in the
General Settings
(Save CSV results to edit-box). Response Time Statistics file is created for each user profile.
For each request you can see the following values in this file.
![]() User: the number of virtual user who made that request,
User: the number of virtual user who made that request,
![]() Request Begin: it is the time when the first byte of page request was sent,
Request Begin: it is the time when the first byte of page request was sent,
![]() Request End: it is the time when the last byte of page request was sent,
Request End: it is the time when the last byte of page request was sent,
![]() Response Begin: it is the time when the first byte of server response was received,
Response Begin: it is the time when the first byte of server response was received,
![]() Response End: it is the time when the last byte of server response was received.
Response End: it is the time when the last byte of server response was received.
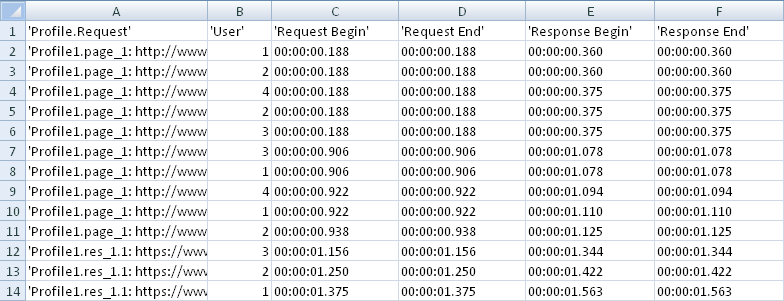
All timing characteristics are calculated from the beginning of test run. The
format of values is hours:minutes:seconds.milliseconds.
If you see several entries with the same name in the Response Time Statistics report, it means that there were
additional requests for some page: redirects, authorization requests and so on. All these intermediate requests are represented in the report.
Values of Performance Counters
If you check the Save response time statistics option in the Extended Results settings, then values of performance counters will be written to special CSV files:
- ScenarioName--date-time-timing-performance-counters-raw-data.csv
This file stores all data gathered by performance counters during the test. Note that the data is written to this file only if the option "Enable logging of raw counter values" is checked in server settings.
- ScenarioName-Performance Counters on ServerName-date-time.csv
This file represents the averaged data on each interval:
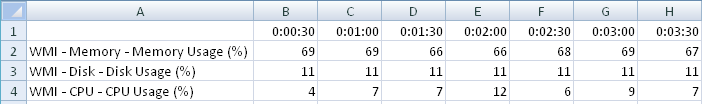
These files are stored together with all other CSV files.
A folder for storage of CSV results is specified in the General Settings
(Save CSV results to option).
![]()