Graphs for Individual Pages
WAPT Pro creates graphs for all page requests of the current test scenario.
Click on any page in the Results folder of the Navigation Pane to see the chart.
There are 3 tabs on the chart:
![]() Timings
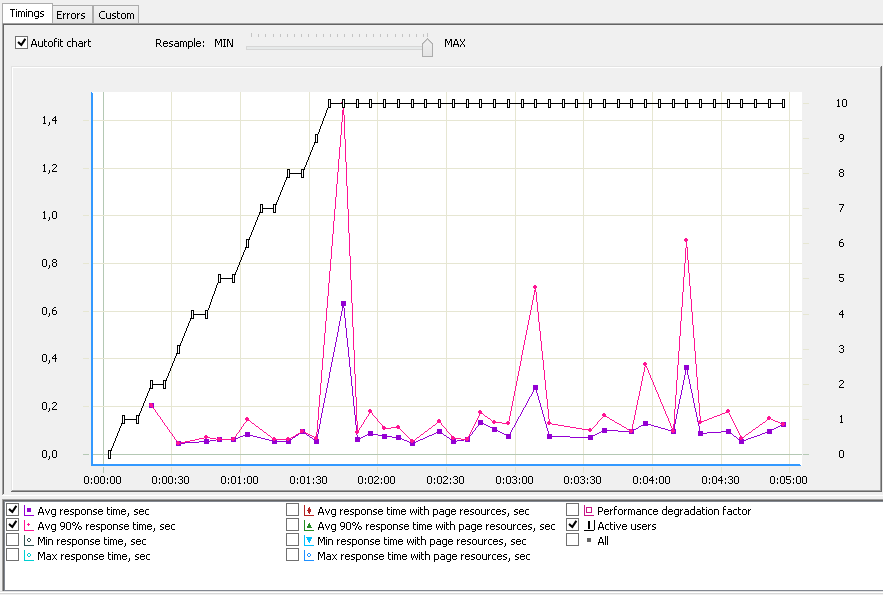
Timings
![]() Errors
Errors
![]() Custom
Custom
You can manually choose what graphs will be shown on the chart. Check/uncheck options below the
chart to show/hide graphs. You can check the All option to display all graphs on this tab.
X axis denotes the time interval of test run.
Y axis is different for various graphs.
Timings tab
Response time tells you how long a user waits for server response to his request. The values of average and maximum response time are the most important results of load testing; they measure web user experience. You should watch how these values change during a test when the number of virtual users is increasing, and verify that users get the response in acceptable time.
Avg response time: Shows values of average response time without page resources.
Avg 80-99% response time: Shows values of Avg 80-99% response time without
page resources. (The level 80-99% is specified in Report Options.)
Min response time: Shows values of minimum response time for the current request.
This time does not include the time for loading page resources.
It is the time of server response to the readable content of web page:
its structure (frames, tables) and HTML text. These resources are sufficient to start reading
a page.
Max response time: Shows values of maximum response time without page resources.
Avg response time with page resources: Shows values of average response time
including the time for loading the page resources.
Avg 80-99% response time with page resources: Shows values of
Avg 80-99% response time including
the time for loading the page resources.
Min response time with page resources: Shows values of minimum response time for this request
with all its resources including images and flash movies.
Max response time with page resources: Shows values of maximum response time
including the time for loading the page resources.
First of all, you need to analyze the response time without page resources as it is the time after which
users can start reading a page. Response time including page resources will help you ensure that users
will not have problems with the download of graphic images and flash movies.
Performance degradation factor: Shows values of performance degradation factor
for the current page.
Active users: Shows the number of virtual users who executed a profile containing this request.
All: Displays all graphs on this tab.
Errors tab
HTTP errors on pages, %: Shows the percentage of responses with HTTP errors from the total number of responses
for the current page.
Network errors on pages, %: Shows the percentage of responses with network errors from the total number of responses
for the current page.
Timeouts on pages, %: Shows the percentage of responses with timeouts from the total number of responses
for the current page.
Validation errors on pages, %: Shows the percentage of responses with validation errors from the total number of responses
for the current page.
HTTP errors on all hits, %: Shows the percentage of responses with HTTP errors from the total number of hits
for the current page, including the errors of page resources.
Network errors on all hits, %: Shows the percentage of responses with network errors from the total number of hits
for the current page, including the errors of page resources.
Timeouts on all hits, %: Shows the percentage of responses with timeouts from the total number of hits
for the current page, including the errors of page resources.
Validation errors on all hits, %: Shows the percentage of responses with validation errors from the total number of hits
for the current page, including the errors of page resources.
Total errors on all hits, %: Shows the percentage of all responses with errors from the total number of hits
for the current page, including the errors of page resources.
Total errors on pages, %: Shows the percentage of all responses with errors from the total number of responses
for the current page.
You can also view the Errors report for details.
Active users: Shows the number of virtual users who executed a profile containing this request.
All: Displays all graphs on this tab.
Custom tab
Custom tab represents all graphs from the previous tabs and also some more graphs:
Sending speed: Shows how many kbits per second were sent to the server for this request.
Receiving speed: Shows how many kbits per second were received from the server for this request.
Sending speed per user: Shows the sending speed per virtual user for this request.
Receiving speed per user: Shows the receiving speed per virtual user for this request.
Data unit (KBytes/kbit, MBytes/Mbit or GBytes/Gbit) used for these graphs is specified in the Report Options.
You can change the data unit and click the Update report and graphs
button in the Report Options. Current graphs will be updated using the new data unit.
These graphs will help you know whether the bandwidth of Internet connection to your server is
sufficient to provide an acceptable level of performance or not.
![]()