Web Server Performance Counters
On the Performance Counters view you can specify web servers that you want to monitor during the test run.
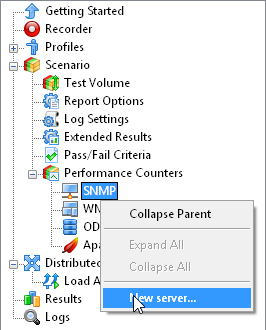
Click the Add button to add a web server to the list of servers that will be monitored.
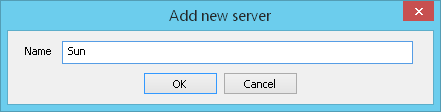
You will see the "Server settings" dialog where you can specify the settings of the new server.
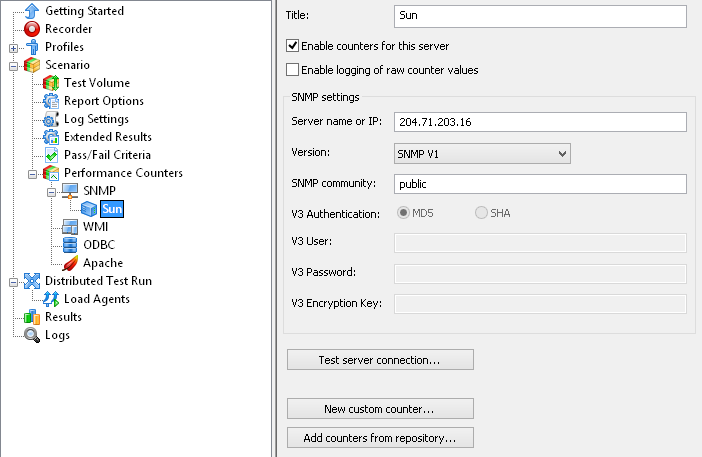
Server: Enter the name of a tested server or its IP address.
Log enable: This option allows generating a log file which contains information about the work of
performance counters. It is saved on the computer running WAPT Pro
in the "Users\[username]\Documents\My WAPT Pro\Logs\[scenario name]\Server Counter Logs" folder.
Monitoring is carried out
by means of SNMP (Simple Network Management Protocol) or WMI (Windows Management Instrumentation)
that can get the necessary information about a remote system.
Mode: Select either WMI or SNMP protocol to obtain performance counters data from the web server.
WMI protocol
For WMI mode you should specify a username and password for authorization. Or you can check the option
Use current user security context to use the logon information of the currently logged on user.
Basic performance counters are predefined in the program:
![]() Memory Usage (%)
Memory Usage (%)
![]() Disk Usage (%)
Disk Usage (%)
![]() CPU Usage (%)
CPU Usage (%)
![]() Network Interface Speed (kbit/s)
Network Interface Speed (kbit/s)
Check the necessary counters in the list to use them during the test.
You can test the settings you have just specified and the work of any performance counter:
select one or several counters in the list and
click the Test button below the list.
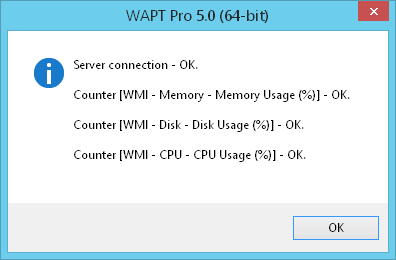
If all specified settings (SNMP/WMI) are correct and the code of selected counters is compiled without errors,
you will see a message that everything is "OK":
Otherwise, if the program is unable to establish a connection to the tested server
(e.g. if you specified the wrong settings or there are connectivity problems), or if there are errors during the
compilation of JavaScript code of selected counter(s), you will see the corresponding error message.
SNMP protocol
For SNMP mode you should select the version of SNMP: V1, V2c or V3.
![]() For SNMP V1 and V2c you should enter the
name of some SNMP community. SNMP default community is "public".
For SNMP V1 and V2c you should enter the
name of some SNMP community. SNMP default community is "public".
![]() For SNMP V3 you should specify a username and
password for authorization and select the type of authentication: MD5 or SHA.
For SNMP V3 you should specify a username and
password for authorization and select the type of authentication: MD5 or SHA.
Adding a new performance counter
To monitor some specific parameters of web server,
you can add your own counters for any additional data available through WMI or SNMP protocol.
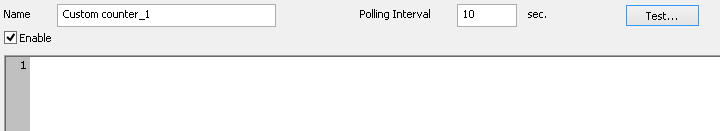
Click the Add button below the list of performance counters to add a new counter.
In the displayed dialog, enter a name, value of polling interval (an interval between probes) and the
JavaScript code that will be executed:
All performance counters are based on the JavaScript functions.
Here you can
see the description of functions that can be used in the JavaScript code.
Using these functions you can perform any required calculations, e.g.
take the previous value of a counter, calculate the average of several
counter's values, add/subtract values, etc.
You can modify existing counters as well. Double-click a counter in the list, or select it and click the
Edit button. This button opens a dialog with the properties of selected counter:
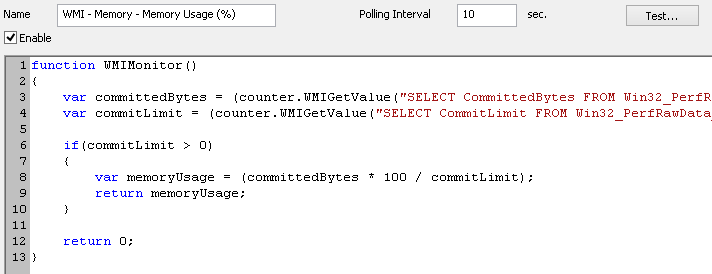
Here you can change counter's name, value of polling interval and JavaScript code.
To delete some performance counter, select it in the list and click the Delete button below the list.
Importing performance counters from another scenario
WAPT Pro stores performance counters in scenario file (scenario-name.wps). You can import performance counters from another scenario (created in WAPT Pro 3.5). Click the Import button and select the necessary scenario file. Imported counters will appear in the list of performance counters of current scenario.
Performance counters in reports and graphs
Values of performance counters are included in generated reports and graphs, so you can see how these parameters were changing during the test. For details see the Performance Data report, HTML Report and Summary Graphs (Server Performance tab).
Besides, if you check the Save test results option in Log and Report Settings, values of performance counters will be written to a special CSV-report stored together with all other CSV-reports. The name of this report looks as follows:
"ScenarioName-PerformanceCounters on ComputerName (WMI/SNMP).csv"
A folder for storage of CSV-reports is specified in the General Settings (Save CSV results to option).
![]()