Examining Logs of Test Run
You can set WAPT Pro to create full logs or failed sessions logs.
Log files will help you know what occurred during test run.
Switch to the Log Settings view and select the type of log file in the
Level of detail combo-box.
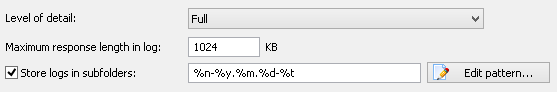
Full log is a comprehensive log of WAPT Pro test run that includes information on all
requests, responses, redirects and returned HTML code.
Note that creation of full logs may require much space on the disk.
Full logs are often used for functional testing or verification
of test scenario with dynamic parameter values.
Failed sessions log contains only failed sessions. If at least one request in a session was executed with errors (its
response code is not "200 OK"), then the whole session is included in the failed sessions log. Redirects are not considered errors.
Besides, if you make additional validity check of server response and receive a validation error for some request, the corresponding session is
also included in the failed sessions log.
If you set WAPT Pro to create full (failed sessions) logs, then the corresponding log file will be
created for each virtual user participating in the test. Also you can create a full log for the first user of each
profile and failed sessions logs for other users (or disable logs for other users).
Users' logs are saved on the computer running Load Agent that generated the load during the test.
If you use several agents in your test, then each of them creates logs for virtual users that it
generated. Users' logs are saved to the folder specified in the
Load Agent Manager
(Store test data files in edit-box).
Names of log files are generated automatically. For example:
0_000_0.log is a full log for the first user of the first profile;
0_001_0.log is a full log for the second user of the first profile;
1_000_0.log is a full log for the first user of the second profile.
Here the first number is the number of user profile, the second is the number of virtual user, and the last
is the number of user's startup in case of periodic user load.
Note that WAPT Pro begins to count the number of profiles/users from zero.
Names of failed sessions logs look as follows:
0_000_0_errors.log
0_001_0_errors.log and so on.
When you open the Logs folder of Navigation Pane, WAPT Pro
workplace downloads users' logs from agents and displays information in the
Logs tree view. The workplace component saves the downloaded
logs to the default location which is specified in General
settings (Save log files to edit-box).
The next time you run a test, logs may be overwritten by new log files.
If you wish to use the generated logs later, you can save them manually by clicking the
Save Logs... option on the File menu.
You can open logs by
clicking the Open -> Logs... button on the program toolbar.
In the displayed dialog, select a desired folder with log files and click Open.
WAPT Pro will
parse log files from the selected folder and display the information in the Logs tree view.
Note. Do not modify log files or their names manually. Otherwise, you will not be
able to open them in WAPT Pro.
Log Viewer
You can view all logs generated during test run just in WAPT Pro.
Expand the Logs folder of the Navigation Pane, and you will see the
tree view with several levels of detail: profile, user and session.
Using the tree view, you will find any information easily without the need to search through megabytes of log files.
You can navigate to any particular request or virtual user.
When you click on any item in the Logs tree view,
you will see the corresponding part of log in the upper right pane.
Requests for page resources (images, CSS, JavaScript, WOFF online fonts and others) are located under the main request in the tree view.
You can use an additional toolbar under the Navigation Pane to
browse virtual users, user sessions and errors one by one.

Additional toolbar becomes active when you click on any item of the Logs tree view.
Below is the example of full log.
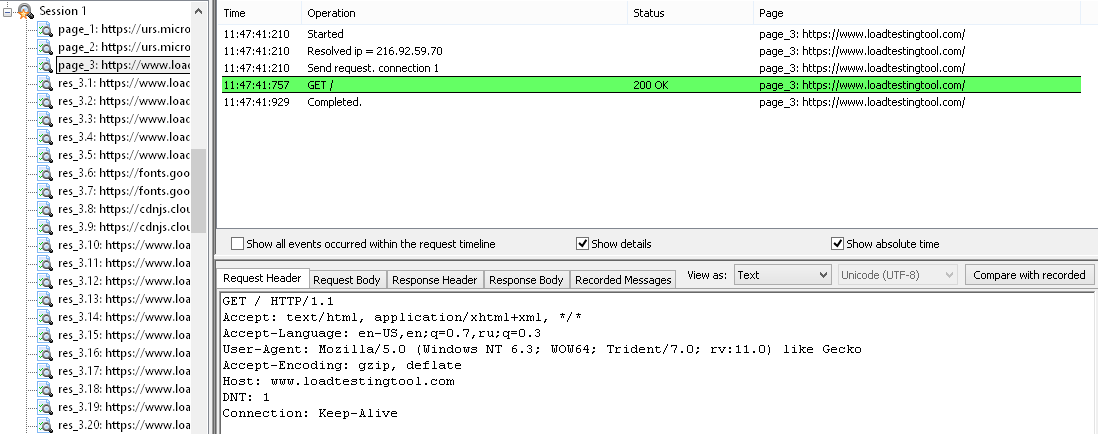
In the upper right pane you can see the sent requests and received server responses.
Request is green highlighted if it was processed without errors, or red
highlighted if there were errors.
Show all events occurred within the request timeline: If you check this option, the log view will show all events
occurred within the time interval of request execution - both relating and not relating to the current request.
Uncheck this option to hide events not relating to the current request.
Show details: If this option is unchecked, the log view shows only successful and failed requests.
They are highlighted with the green or red color correspondingly.
All other events (not highlighted in the list of events) are hidden in this case.
You can check this option to show all requests and events.
Show absolute time: Using this option you can switch between the absolute time
(the local time on computer running WAPT Pro workplace component) and time passed from the
beginning of test run.
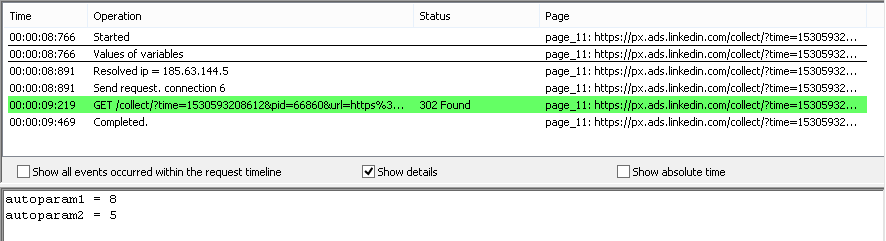
There is a special row Values of variables above the main request. If you click it, you will see the list
of variables created during this session for the current page and all the previous pages. Next to each variable
you can see its current value.
Note that if some variable is not actually used for parameterization of requests, it is not created during the test and
is not represented in user's log (except for verification tests where all variables are created during the test and
shown in the log).
If you used several IP addresses for your test (IP spoofing feature), then user's
log would show which of IP addresses was used for execution of the current user session.
The lower pane has several tabs where you can see the request/response details.
Request Header: Here you can see the HTTP header of sent request.
You can select different representations in the
"View as" combo-box: "Binary" (to view the data in the binary form),
"Text" (to view the data in the text form)
and "Url parameters" (to see the list of URL parameters).
Request Body: The body of sent request is shown on this tab.
You can select different representations in the
"View as" combo-box: "Binary" (to view the data in the binary form),
"Text" (to view the data in the text form)
and additional option for POST requests: "Form Data" or "Multipart Form Data" depending on the type of POST request.
Response Header: Here you can see the HTTP header of server response.
You can select different representations in the
"View as" combo-box: "Binary" (to view the data in the binary form)
and "Text" (to view the data in the text form).
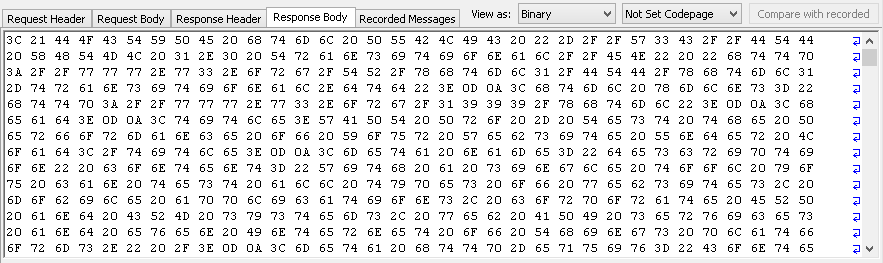
Response Body: The body of server response is displayed on this tab.
You can select different representations in the
"View as" combo-box: "Browser View", "Binary", "Text" and "Json".
If you select "Binary", you will see the data in the binary form:
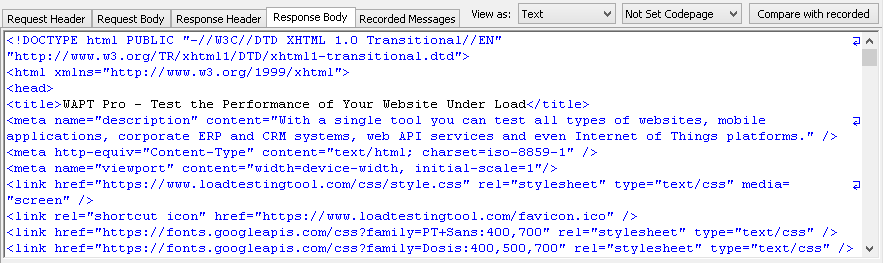
If you select "Text", you will see the data in the text form:
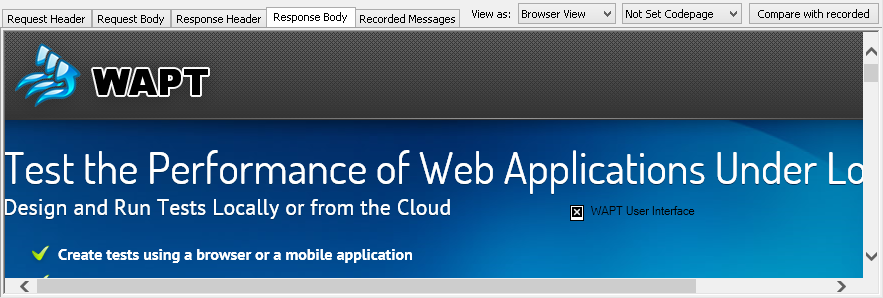
If you select "Browser View",
you will see the server response as it is displayed in browser without images.
If the displayed web page has incorrect language encoding, you can select another encoding for it.
In case you select the "Text" representation on these tabs,
you can search for some text string in the html code.
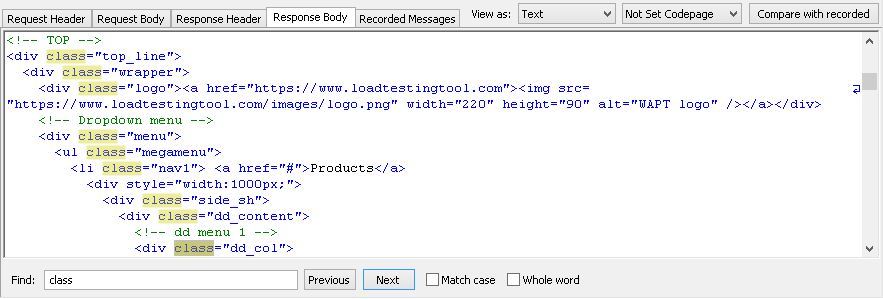
Find: Type the text that you want to find. The program will highlight all occurrences of the
entered text.
Use the Previous and Next buttons to move to the previous/next occurrence
of the text.
Recorded Messages: This tab shows the sequences of incoming and outgoing messages recorded for current request.
For each message you can see its time
of recording calculated from the beginning of the test.
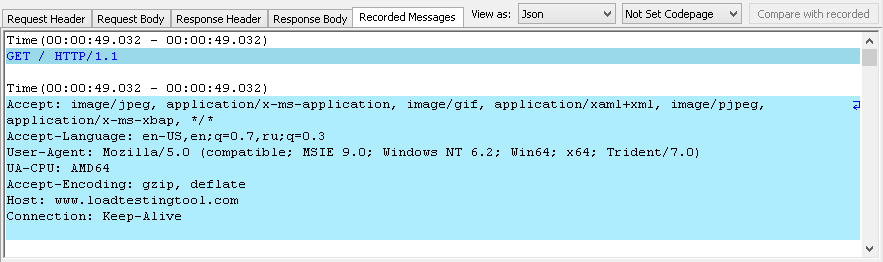
![]() Received messages are shown on the green background
Received messages are shown on the green background
 .
.
![]() Sent messages are shown on the blue background
Sent messages are shown on the blue background
 .
.
![]() Messages of the same type going one after another
are shown with different tones of the same color.
Messages of the same type going one after another
are shown with different tones of the same color.
Logging the Work of Operators
If you add operators to the sequence of requests, WAPT Pro will
log their work as well.
![]() JavaScript
JavaScript
This operator writes messages to the log with the help of
log object and its 2 methods:
log.message (writes a text message to the log) and
log.error (writes an error message to the log).
So you can define what information will be written to the log in your JavaScript code.
![]() Loop
Loop
For this operator you can see the current number of loop iteration in the log, for example:
Operator Loop: Loop_1_iteration = 2
![]() While
While
For this operator you can see whether the specified condition is true or false:
Operator While: "0 LessOrEqual 2" is true
or
Operator While: "3 LessOrEqual 2" is false
![]() If Then Else
If Then Else
For this operator you can see whether the specified condition is true or false:
Operator If: "0 Less 2" is true ->Then
or
Operator If: "2 Less 2" is false ->Else
![]() Random
Random
For this operator you can see the name of executed request (requests are executed randomly),
for example:
Operator Random: page_3: http://loadtestingtool.com/support.shtml
![]() Task
Task
For this operator the log indicates that there is a group of pages relating to the same business action (transaction)
at that place.
![]() Delay
Delay
For this operator you can see the value of delay:
Operator Delay: 3 seconds
![]() Stop Session
Stop Session
For this operator the log indicates that execution of the current session was stopped at that place.
![]() Stop Test
Stop Test
For this operator the log indicates that test execution was interrupted at that place.
Compare Recorded and Test Requests/Responses
When browsing logs you can compare requests and responses saved during the test run with the initially recorded ones.
This feature can be used to determine the data that is unique for each session and parameterize corresponding requests
correctly.
You can compare request/response headers and bodies.
Select the corresponding tab (Request Header, Request Body, Response Header or
Response Body) and click the
Compare with recorded... button. In the displayed window you will see the differences
between the recorded and test request/response headers or bodies.
If they are identical, you will see the corresponding message.
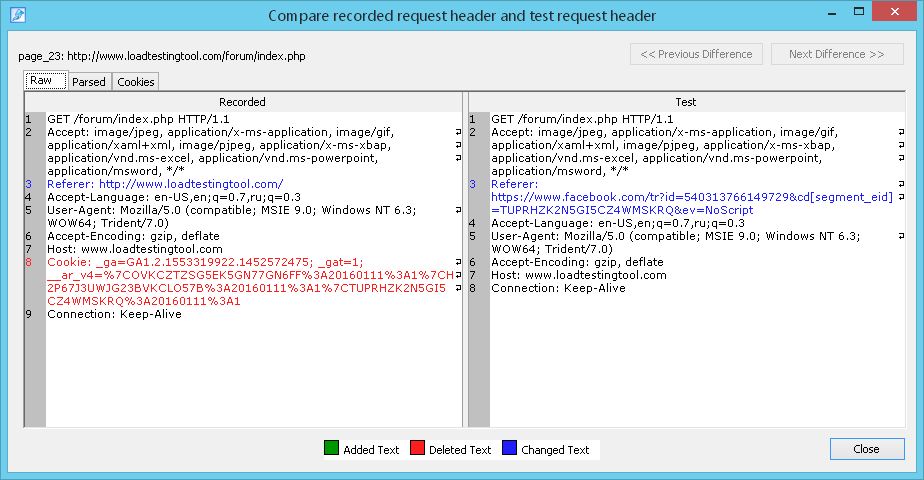
For headers you will see 3 tabs: Raw, Parsed and Cookies.
The Raw tab shows the list of headers in the raw form (not parsed and not sorted):
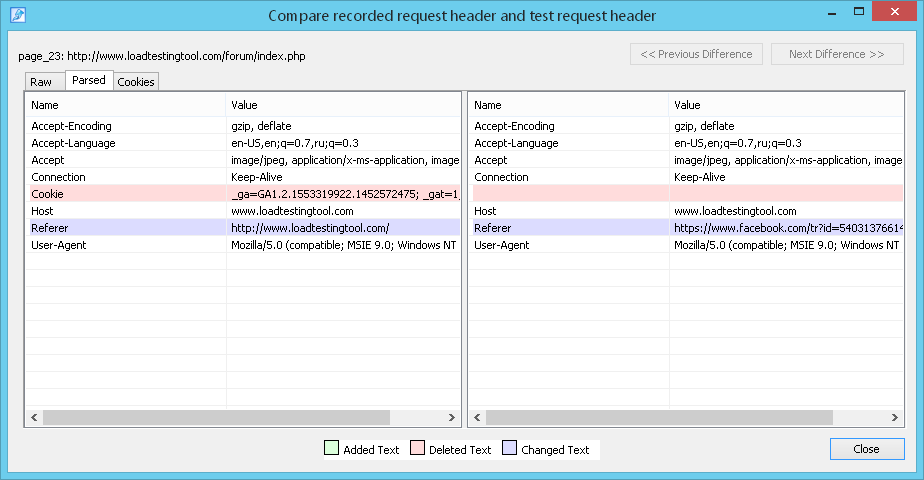
Switch to the Parsed tab to see
the list of parsed headers sorted in the alphabetical order:
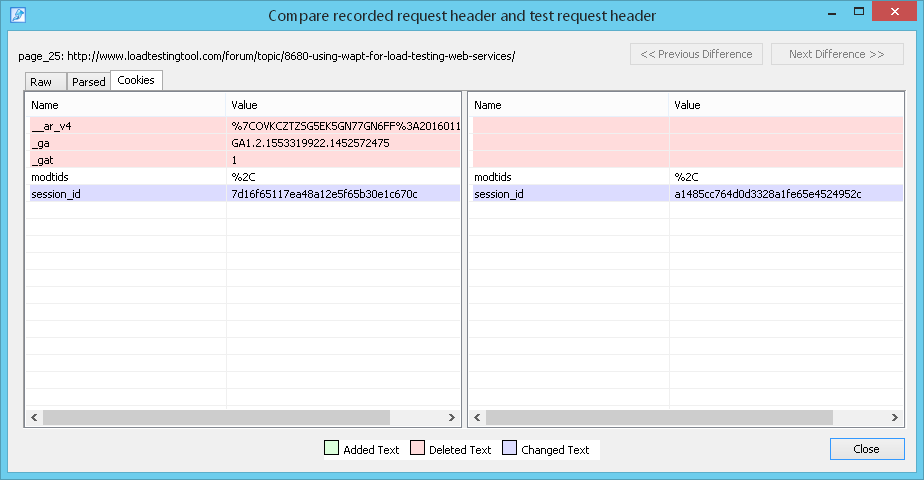
On the Cookies tab you can see the list of cookies - also parsed and sorted in the alphabetical order:
The legend at the bottom of the dialog shows which colors are used for added, deleted and changed text in this view.
![]() Added text is a text which is present only in the right pane.
Added text is a text which is present only in the right pane.
![]() Deleted text is a text which is present only in the left pane.
Deleted text is a text which is present only in the left pane.
![]() Changed text is a text which is different in these two panes.
Changed text is a text which is different in these two panes.
If recorded and test headers are the same, but have different location in the text, such headers are considered identical.
Use the Previous Difference and Next Difference buttons to browse differences
one by one.
![]()