Support of Jenkins Pipeline Plugin
Jenkins Build Pipeline Plugin was developed for better support of the Continuous Integration process.
This plugin allows to form a chain of jobs based on their upstream/downstream dependencies.
You can also see a history of pipelines in a view, the current status and where each version is in the chain based on its revision number.
For details see the Jenkins documentation.
WAPT Pro supports the Jenkins Pipeline Plugin. You can write a Pipeline script
which calls some command. In particular, you can write a script which calls the commands of
running a test scenario, archiving build output artifacts and publishing WAPT Pro reports.
• Creating a new Pipeline item
• Pipeline syntax for WAPT Pro items
• Analyzing the Stage View
Creating a new Pipeline item
Note. You should have the Build Pipeline Plugin installed in your Jenkins console.
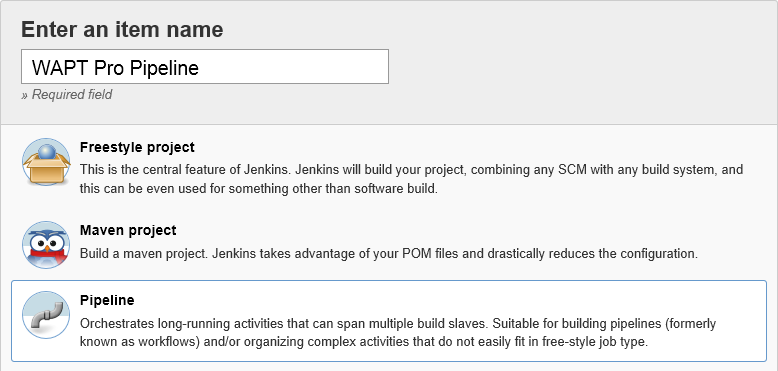
- In Jenkins homepage, click the New Item to create a new job.
Type a name for your new job and select the option Pipeline. Then click "OK".
-
In the Pipeline section, select the option Pipeline script and enter the script.
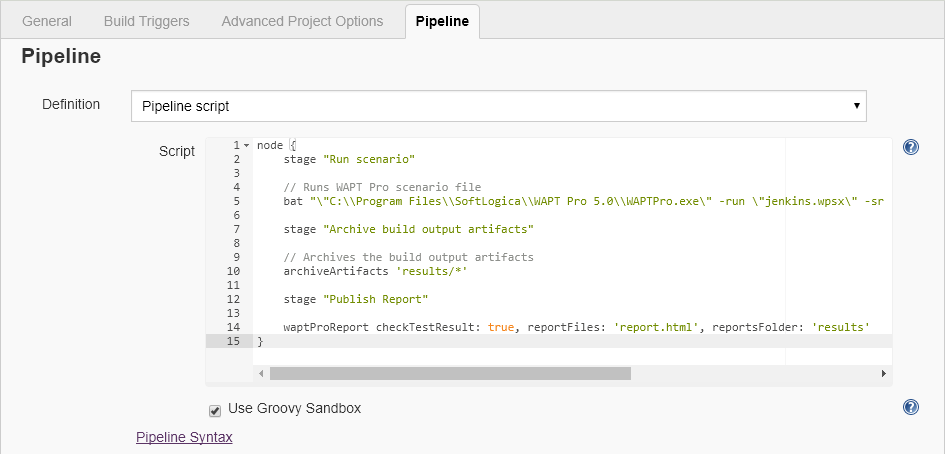
This script has 3 stages. The first stage runs WAPT Pro scenario, the second - archives the build output artifacts and the third - publishes WAPT Pro report.
Here is the full listing of this script:node { stage "Run scenario" // Runs WAPT Pro scenario file bat "\"C:\\Program Files\\SoftLogica\\WAPT Pro 5.0\\WAPTPro.exe\" -run \"jenkins.wpsx\" -sr \"results\\testscenario.wprx\" -hr \"results\\report.html\" -noui" stage "Archive build output artifacts" // Archives the build output artifacts archiveArtifacts 'results/*' stage "Publish Report" waptProReport checkTestResult: true, reportFiles: 'report.html', reportsFolder: 'results' } - Save the new Pipeline item. It will appear in the list of items in the Jenkins console.
Pipeline syntax for WAPT Pro items
Jenkins has a special Snippet Generator that can help you learn the Pipeline Script code which can be used to define various steps.
To use this generator, select a pipeline item in
the management screen of Jenkins and click the Pipeline Syntax option:

In the example above we used a command which archives the build output
artifacts and a command which publishes WAPT Pro report.
- Archive the build output artifacts
Select the step archiveArtifacts: Archive the artifacts in the list of sample steps:
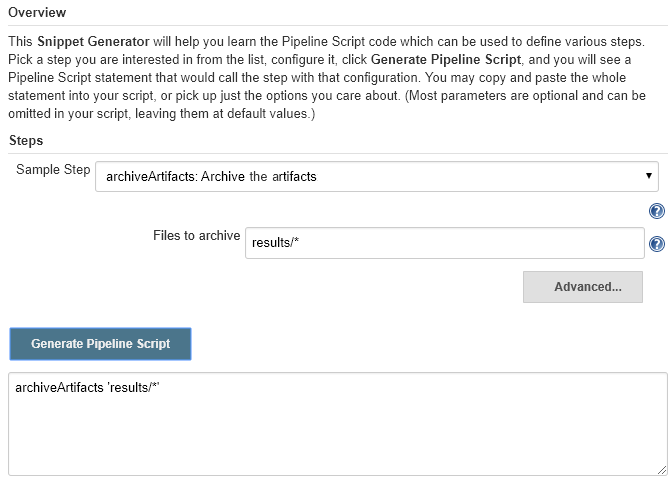
Specify files to archive. (For details see the description of Post-build Actions.)
Click the Generate Pipeline Script button, and you will see a Pipeline Script statement that would call the step "Archive the artifacts". You can copy this statement and paste it into the Pipeline scripts of your items.
- Publish WAPT Pro reports
Select the step waptProReport: Publish WAPT Pro reports in the list of sample steps:
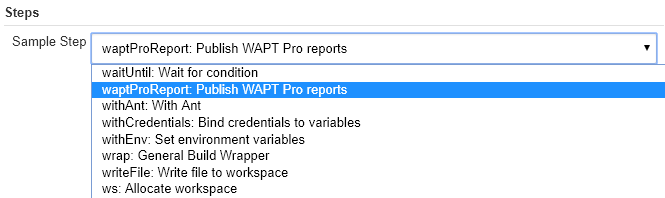
Enter "WAPT Pro output files folder" and "WAPT Pro report file". (For details see the description of Post-build Actions.)
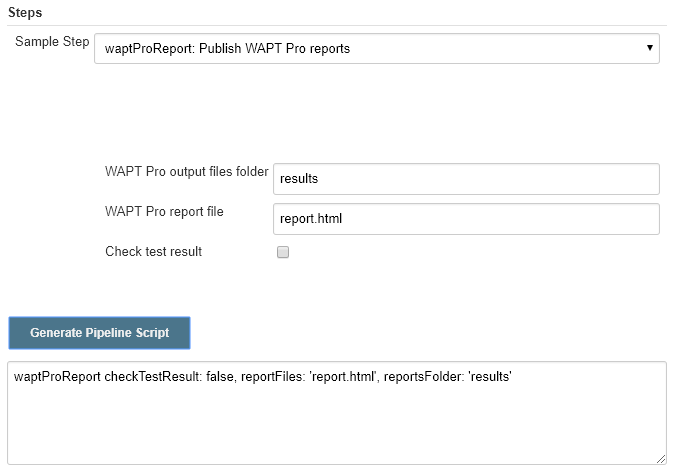
Click the Generate Pipeline Script button, and you will see a Pipeline Script statement that would call the step "Publish WAPT Pro reports". You can copy this statement and paste it into the Pipeline scripts of your items.
Analyzing the Stage View
The Stage View of a pipeline item shows the run time and stage statistics.
-
In the management screen of Jenkins, select a pipeline item and click Full Stage View:

to display the item's Stage View:
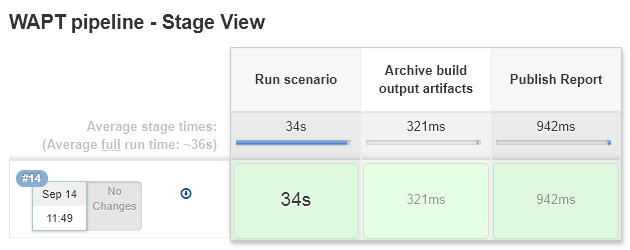
Names of columns are the same stages that were defined in the Pipeline script: (1) Run scenario, (2) Archive build output artifacts and (3) Publish Report. You can see the average times for each stage and also the average full run time.
-
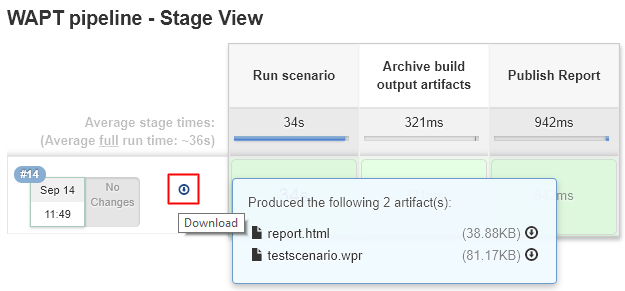
You can click the Download icon to download the produced artifacts:
-
You can see the log for any stage. In our example there are 3 Stage Logs: (1) Run scenario, (2) Archive build output artifacts and
(3) Publish Report. Click the pop-up icon Logs for any stage to open its log:
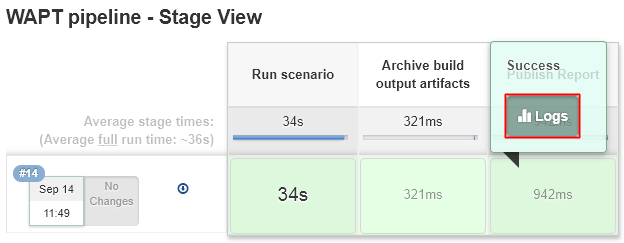
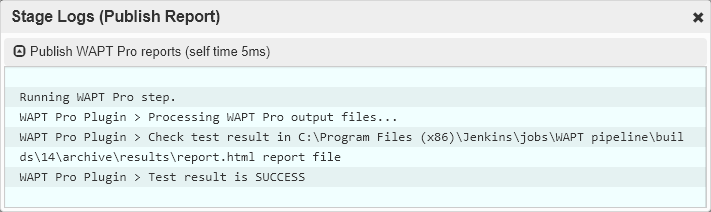
Here is the log for the last stage "Publish Report":
![]()