12 typical confusions for a novice load tester

After several years of work with our customers I decided to summarize my experience by gathering the most common user confusions resulted in questions to our technical support service. I think that most of these issues were caused by wrong ideas or interpretations people may have had. In other words, in each specific case the problem was caused not by the lack of information, but rather by some sort of incorrect assumptions.

Of course, nothing like that would be possible if everyone spent couple hours reading the user guide before trying to use the product. But for some reason people rarely do it this way.

1. Confusion between virtual users and user sessions.

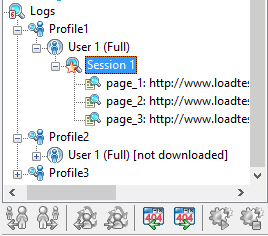
A very common mistake for novices is to think that each virtual user executes exactly one session. This is not so. Otherwise it would be hard to control the test volume during the test. To keep it on the same level you would need to add a new user right after some old one finishes its session. Instead of that, the same user just starts a new session, which is completely independent from the previous one. This is essentially the same thing, but in different terms.

So, in fact, each virtual user executes sessions one by one. As soon as it completes a session, it starts the next one, and so on until the test is finished. Thus, each virtual user emulates several successive real users and can execute corresponding number of sessions during the test. At any moment the number of active concurrent sessions is equal to the number of virtual users. In case of ramp-up load, the more users you add, the greater load will be created against the web site.

Some people confuse the number of concurrent users with the total number of user sessions in the test. Sometimes after seeing in logs several sessions for the same user, they ask how to make each user execute exactly one session. While this is possible to implement with the “Stop user” operator, this is rarely required in practice. You only need to understand that all successive sessions of the same user are totally independent from each other. Replacing one user with another is the same as starting a new session independent from the previous one.

2. Emulation of different browsers.

A very typical user question is: which browser is used in WAPT for the emulation of virtual users? This question probably arises from the necessity to test an application from a specific browser.
WAPT does not use any browser when running the test. That would be very inefficient, because browser object consumes significant system resources. It would be hardly possible to run thousands browsers on a system.

So, WAPT performs all the emulation by itself. To emulate a user session it sends the recorded sequence of HTTP requests with only some modification of the session-specific values.
The site determines the client browser by the “User-Agent” header. In general, you can change that header in a recorded profile. However in some cases web sites provide different content for different browsers. So, if you want to emulate a specific browser, use it for recording.

3. Requirements in terms of number of transactions per second.

A very typical question is: how can I make WAPT execute exactly 100 transactions per second? Why I cannot set this directly?

The answer is: because the number of virtual users required for this depends on the performance of your web site. WAPT emulates the behavior of real users, not some separate transactions. What if the site is not capable of serving more than 50 transactions per second? How can we emulate 100 ones in such case?

In fact, the number of transactions (sessions, pages or hits) per second may be a good indicator of the site performance. However it is not appropriate to set it as a requirement for the test specification.

4. Understanding of session execution speed.

Real users do not click links and buttons one by one. They make pauses to read page content, think, type something, etc. Load testing tools emulate those pauses by inserting delays between HTTP requests. The duration of each pause is called “think time” and can be adjusted in the properties of the corresponding request.

Some WAPT users do not take the above into account or do not understand the importance of those settings. If you increase or decrease think time, you can change the resulting test volume dramatically without changing the number of virtual users.

Initially think times are set on recording. That is why if you start recording a session, then decide to have a tea break, then get back and record the rest of the session, somewhere in the middle of your profile you will have a 15 minutes pause, which will be reproduced during the test.

Note also that when you verify a profile, think times are ignored. That is why verification may work significantly faster.

5. Test recording issues.

Sometimes it is not properly understood that a session can be correctly replayed only if it has been recorded correctly. To do this, you should always start the process from entering the landing page URL to the address bar. If you already have a page open in a browser, you should not start with clicking a link on that page.

It is also important to delete browser cache and cookie files before recording. WAPT can do this automatically if you leave the corresponding options checked in the “Recording Options” dialog.

If you do not follow the above rules, the recorded session will be valid only for the environment existing on your system before you started recording. WAPT will not be able to fully reproduce the corresponding state during the test and the session will be executed incorrectly.

In general, it is possible to append new content to an existing profile. It is even possible to move and duplicate requests inside a profile. However these features are really not for beginners. This means that you should use them only if you understand very well what you are doing. Otherwise you can easily break the session integrity.

6. Ignoring of logical errors in user sessions.

I can only guess how many people test their web applications with incorrectly working tests. They just record a user session, specify the load parameters and click the “Run” button. If they get some values for response time, they think that this is ok.

In fact, in such a manner you can test only very simple web sites with mostly static content. Many web applications will not let you use the same user account to login in multiple concurrent sessions. If the session changes somehow the internal state of the system, you cannot repeat it again and again with the same initially recorded parameters. Session-specific values should be replaced with variables before the recorded session can be replayed correctly.

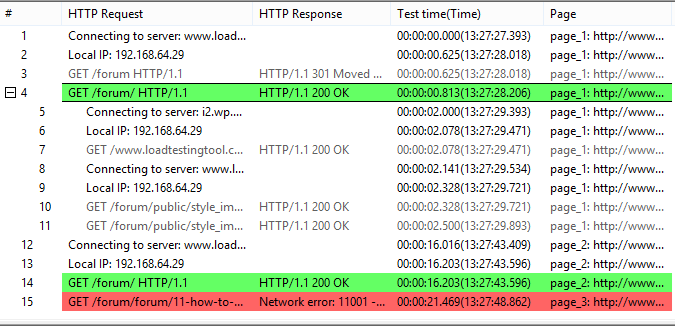
The problem is that in some cases web applications do not report errors through HTTP codes. That is why you may see only successful sessions in the report even if the emulation is totally incorrect. To understand that something goes wrong, you need to check logs. Unfortunately many users do not care about that.

7. Wrong approaches to parameterization.

After the above mentioned problems are fully understood, people usually start thinking on how to avoid them. In the best case scenario they spend couple hours reading user guides or watching demo clips showing how to deal with session-specific values. Unfortunately many users feel that they are too busy to read anything, so they start inventing their own methods.

A very typical situation is when people duplicate the same profile to change some values in the created copy. So, instead of a single profile with parameterized values they create hundreds copies and manually replace values in every copy. They stop this only when they see that WAPT cannot handle so huge amount of test sources.

Another typical mistake is to try using predefined lists for session-specific values created by the server. In such cases you need to extract values from the server responses rather them take them one by one from the predefined files.

8. Misinterpretation of the 304 and 401 HTTP codes.

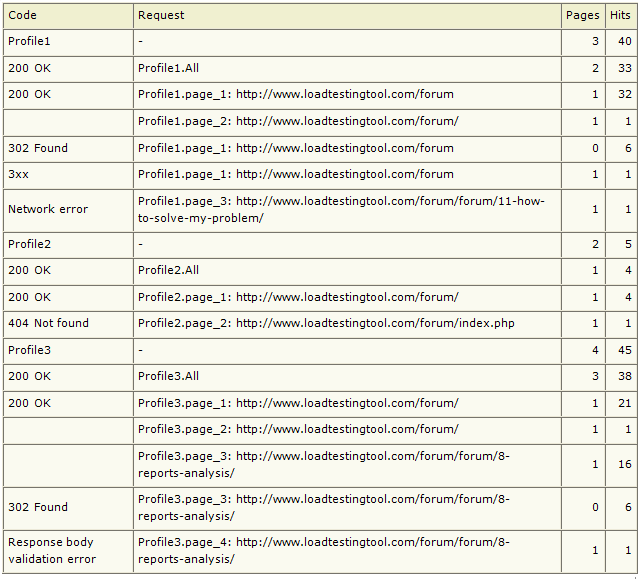
After verifying a test and seeing the 304 code in some responses people often start thinking that something went wrong. This is not so. All 3XX codes mean that the server redirects the request to a new URL provided in the response. In such case the client sends another request to that new URL. So, if you see the 3XX code, this only means that the corresponding page required sending more than one HTTP request to complete. There may be several redirects for the same page and the last result can be either success (200 OK) or error (4XX or 5XX).

A similar situation is the 401 code. Formally, this is an error, but it is always returned in case the site requires authentication. So, it is normal if you see it. All you need to do is to specify correct credentials in the profile properties. You will still see that message (or even two such messages) in the log for that page, but it will be followed by a response with another code and actual page content in the response.

Overall, I would recommend taking a look at the HTTP response codes reference before working on web testing. This may take some 10 minutes.

9. Handling of different authentication schemes.

There are several authentication schemes used in web applications. When you access your site from a browser, a popup window may appear asking from credentials. This means that the site requires authentication. In such case you need to enter the credentials in the profile properties.

However note the following.

  • In some cases browser may use your system account credentials and will not show that dialog on recording. Still you need to enter credentials in the profile properties, if you see the 401 code on verification.
  • User name may include domain name. This is often forgotten.
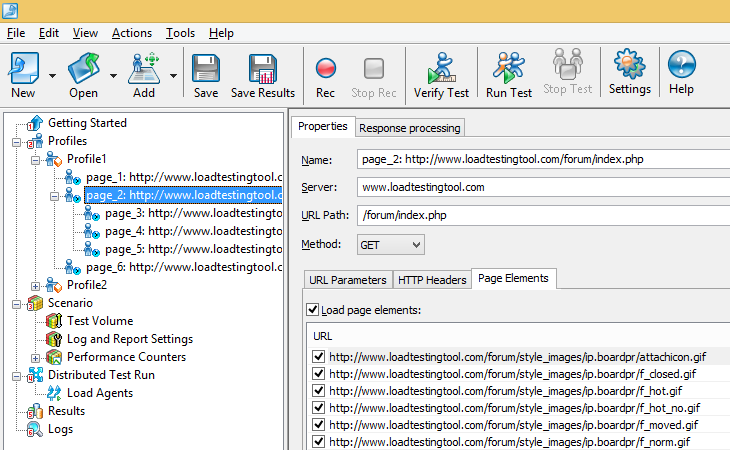
  • If you enter user name and password on the login page (not in the standard security prompt window), most probably the authentication is performed by sending the credentials in the parameters of the login request. This is an application-specific authentication and in such case you do not need to specify anything in the profile properties. You can parameterize the values of the user name and password directly in the properties of the corresponding request as shown here.
  • Some sophisticated sites may use encryption to avoid sending passwords in the explicit form. The only way to deal with such cases is to implement the same encryption in JavaScript. This only refers to the application-specific authentication.

10. Tests containing file uploads.

I do not know why I get so many questions on how to create a test containing file uploads. For some reason people think that file upload is a special feature. In fact, it is done with a usual POST request that contains a number of parameters in its body. One of those parameters is the file itself. In WAPT you simply specify the file to be used for this purpose. You will be prompted for this after recording the test.

Of course, you can parameterize the file, so that different ones would be used for different sessions. This is done by using variables in the file name specification. Note that in case of WAPT Pro the provided file name and path should be available from all load agents.

11. Testing through a proxy server.

If you are using WAPT inside a corporate environment, there is a high probability that your access to external network resources is limited. HTTP connections may be allowed only through a proxy server. This usually does not cause any problems when you record a user session. However to run a test from such environment you should either specify your proxy server in the load agent settings or ask your network administrator to allow direct connection.

The problem is that in most cases people prefer the first approach (testing through the proxy), which is very bad. This may work only if you are sure that the performance of your proxy server is far beyond the performance of the web application you are testing. By running test through a proxy you actually add one more component to the system. If that component becomes a bottleneck, your test results will be incorrect.

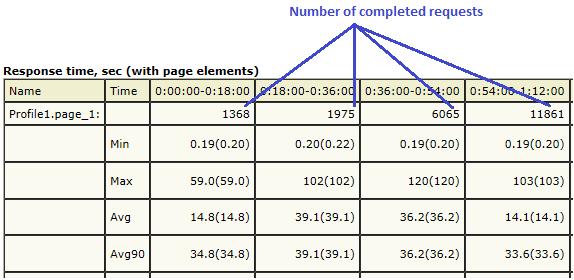
12. Test results interpretation mistakes.

Finally, people make many mistakes when interpreting test results. However this theme is too wide to discuss here. Again, the problem is usually that a certain value in the report is treated incorrectly. Report contains more than 20 tables with values. Each table is described in the help file that comes with the product. I would very much recommend reading the corresponding description before making any conclusions. If you are in doubts, you can always run couple small tests with different parameters and predictable results to check how each value is calculated. You can enable logging to confirm your understanding. If you see anything strange, just send your results and questions to our technical support and we will help you: support@loadtestingtool.com.

Posted in General, Testing practice, WAPT usage | Tagged , , , | 4 Comments

Performance glitches on charts

Glitches 
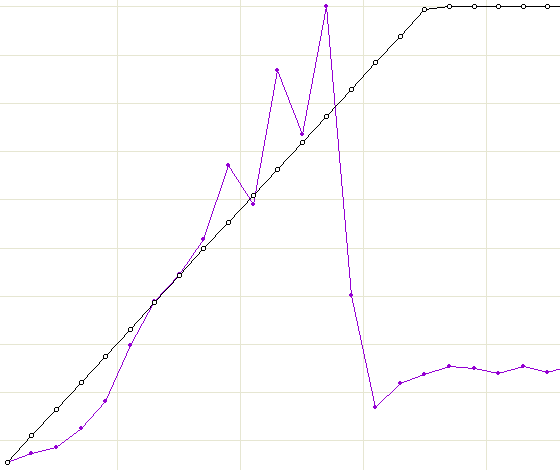
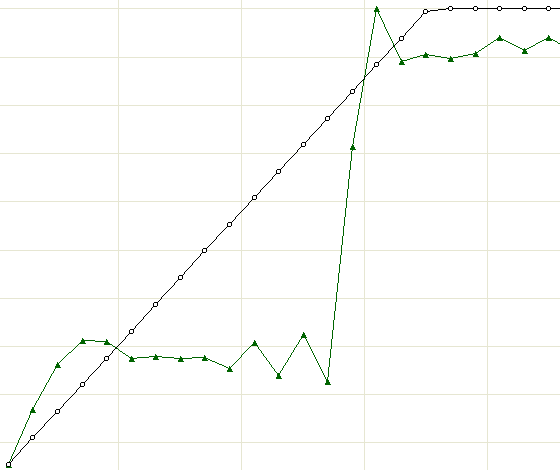
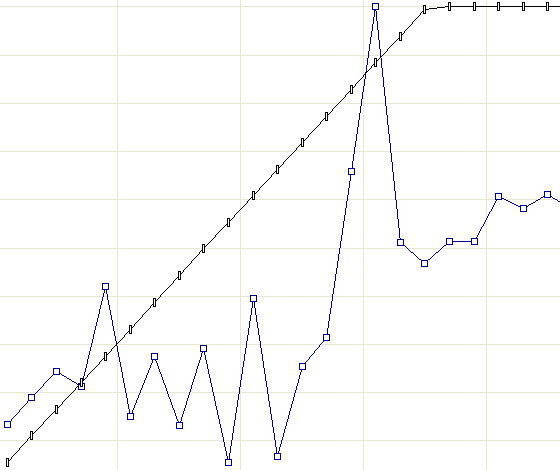
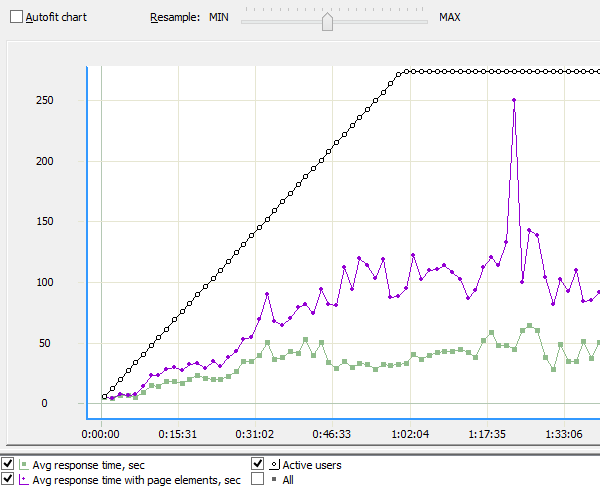
When you load test a web application and gradually increase the number of virtual users during the test, you usually expect to see gradually degrading performance parameters such as response time. The number of pages (sessions or hits) per second will reach maximum in some moment and will probably stay the same for the rest of the test despite the growing load. This is simply because the site cannot serve more requests per second, so it has to postpone the new coming ones.

In reality you will probably see something like that, but only for a limited time. When the load goes even higher, you can get another picture that may seem surprising at first glance. It is illustrated by the following three charts. Black line in all charts represents the number of virtual users.

Response time

Response time

Number of pages per second

Number of pages per second

Error rate

Error rate

As you can see, at some point in time the response time drops while the number of pages per second goes up. Looks like the site started to perform much better. However this is a misleading impression. The error rate chart explains the situation. It shows that the number of errors picked exactly at the same moment.

Now we can interpret what we see. When the load on the server started to grow, it produced longer and longer delays. The response time got higher. At some moment the server had to drop the waiting connections, which resulted in the avalanche of errors and reconnect attempts.

Note that different requests can produce significantly different load on the site. A request to a static page only produces some load on the web server. It does not require any work from other system components. So, after virtual users massively restarted their sessions, the site switched from serving “heavy” requests to “light” requests. As a result, the averaged performance parameters improved. Of course this does not mean any change in the actual performance.

Conclusion: when analyzing response time and throughput numbers you should always take into account the error rate and session logs. You can directly compare performance numbers for different test periods only if the activity of virtual users is similar for those periods.

Posted in Testing practice, WAPT usage | Tagged , , , | 1 Comment

How to analyze a load test report? Part 4: Response time.

Let’s suppose that you have already resolved all problems related to unexpected errors in your test. I mean that your site may produce some errors on heavy load, but the emulation of the user sessions is performed correctly and the error rate is acceptable. If this is not the case, or you have any doubts, you may want to read my earlier posts here and here.

If the errors are not an issue, your next step is to look at the most evident indicator of the application performance – its response time. This term initially refers to a time required for your application to respond to a user action. This looks very simple, but you should keep in mind the following things, if you want to analyze the test results correctly.

1. Different actions can have significantly different response time and provide different load on the system. For example, if you search a document by a keyword, your application sends a query to the SQL server. This may take much more time than retrieving a document by its ID or clicking a menu item. That is why it is more important to check response times of critical actions.

2. Each user action in a load test is represented by one or several HTTP requests. So, instead of considering time required for a response to a user action, we always consider time required to reply to a certain HTTP request. Load testing tools do not render pages received from the server. This would require too much system resources and would make it impossible to emulate thousands users on a single system. That is why we do not measure any client-side parameters, such as rendering time. We only measure the time required for the server side of your application to react.

3. Each page request can be followed by a number of additional requests that retrieve page elements, such as image files. Depending on what exactly you want to check you may need to monitor time required to receive all these elements. WAPT provides both values in the report: total time with page elements and response time for the main page request only. The latter may be important, because it is usually in better correspondence with the performance of all application components. Static page elements retrieval only depends on the web server and network performance.

Note that the page elements for each request are specified on the corresponding tab in WAPT.

Page Elements

Response time with page elements is provided in the report near the main page response time in parentheses.

Response time in the report

4. You may want to check time required to execute several successive requests. In WAPT you can do this by joining those requests with help of the Task operator. There are two options for the calculation of task time shown below.

Task options

Task times are provided in a separate report table.

5. In general, response time may have several different interpretations depending on how exactly the time interval is measured. In WAPT this term (response time) stays for the time interval that starts on sending the very first byte of the request and ends on receiving the very last byte of the response. There are two alternatives. Download time is measured from the first byte of the received response to its last byte. Processing time is measured from the moment when the request has been fully sent to the last byte of the response.

Response, download and processing times

6. If you compare response times for the same HTTP request in different user sessions, you may get significantly different values. So, if you monitor response time in a test with a big number of concurrent sessions, in each time interval you will have many response times for the same request. How to analyze this data? The most usual approach is to calculate the average response time. The drawback of this approach is that it can create a wrong perception of the site performance in case of an unusual distribution of the received values.

A simple example: consider the following set of values: { 1, 2, 3, 110, 2, 2 }. Average value is 20. However this is not a “typical” value from the set. It would be more natural to say that the set consists of values close to 2, but also contains some occasional big numbers like 110. So, besides the average value you may also want to check the minimum and maximum values.

Finally, there is one important value, which is called Avg90. It specifies the upper bound for 90% of all values from the considered set.

For example, let’s consider this set: 1, 2, 3, 4, 5, 6, 7, 8, 9, 10.

Simple average value = 5.5, Avg90 = 9.

If you want 90% of all requests to complete in N seconds or faster, Avg90 should be smaller or equal to N.

7. To check the performance of your web application you should see how the above mentioned values change over time with the growing load. This means that you will need to consider the averaged values for several time intervals. In each interval the number of concurrent virtual users should be different.
It is important to consider big enough intervals. Otherwise you will have to take into account values calculated basing only on few results. One occasional spike can dramatically change the picture. WAPT provides the number of request completions for each test phase in the report. You can see it in the “Response time” table on the same line with the request name.

Also, each graph has a special “Resample” slider that lets you adjust the interval length.

Time intervals

Conclusion. You need to take into account the architecture of your web application and select a set of valuable response time parameters. Such set should let you estimate the performance of each component of your application as well as the overall system performance. The final goal, however, is to estimate how each of these parameters change depending on the created load and check that they all remain within the allowed range.

Posted in Testing practice, WAPT usage | Tagged , , , | 15 Comments

Connecting to WMI on a remote system

Windows Management Instrumentation (WMI) is one of the common interfaces used to retrieve information from a Windows system. Such information can include values provided not only by the system itself, but by various software programs running on it. That is why WMI is widely used to monitor the performance and correct operation of the server components.

Many load testing tools, such as WAPT Pro, can monitor performance counters directly from the tested servers with help of WMI. The most useful counters are those representing CPU, RAM and network usage, but there can be other server-specific ones that you can easily retrieve.

WMI is enabled by default on all Windows systems starting from XP. However, while WMI usually works fine inside a Windows domain, it becomes a big problem if you want to connect to a remote server and monitor it the same way. You can resolve this problem in a number of ways. This article describes probably the simplest solution.

I suppose that you have administrative access rights for the client system (from which you want to monitor) and for the server system (to witch you will connect). This is required to make the necessary modifications to the configuration of each system.

On the client system you will only need to modify the “hosts” file. The full path to this file is: “C:\Windows\System32\Drivers\etc\hosts”. (Depending on your system drive it may start from a different letter.)

You need to add a line that will let your client system resolve the local name of the remote system to its public IP address. In the following example, the name of the remote system is WIN-DCBE13F8THL and the IP is 180.10.20.30:

180.10.20.30 WIN-DCBE13F8THL

You can get that system name in the following dialog.

wmi_1

Now let’s configure the server system. Open the “Component Services” window. You can find it through the Control Panel or Server Manager.

wmi_2

Select the “DCOM Config” item in the left view as shown on the following screenshot.

wmi_3

In the right view locate the “Windows Management and Instrumentation” item, right click on it and choose “Properties” from the popup menu.

Open the “Endpoints” tab, click the “Add” button on it and choose the “Use static endpoint” option. Specify any unused port (preferably higher than 10000). The client will connect to this port over TCP/IP, so you need to open it in all firewalls you have between the systems. This includes local server Windows Firewall as well.

In the following screenshot we use port 16100 as an example.

wmi_4

You will also need to open same access for the port 135, which is the standard WMI port.
Click “Ok” in all dialogs.

In the Command Prompt execute the following command (do not forget to run the prompt window “As Administrator”):

winmgmt /standalonehost

wmi_5

Restart the WMI service. You can do this from the Services window.

wmi_6

Alternatively you can just type the following in the Command Prompt:

net stop winmgmt
net start winmgmt

A short summary of all steps for the server side:

  1. Specify the endpoint port.
  2. Open connection to that port and port 135 in all firewalls.
  3. Execute the “winmgmt /standalonehost” command.
  4. Restart the WMI service.

Now you can connect to the remote server WMI. Do not forget to specify the credentials for an account that has the corresponding rights.

Here is an example of the WAPT Pro performance counters window that connects to the server we configured.

wmi_7

Posted in General, WAPT usage | Tagged , , | Leave a comment

How to analyze a load test report? Part 3: Errors.

If you see any errors after executing a load test, first of all you should check if this is a test design problem. I wrote about the most typical problems of that kind here.

Now let’s suppose that the test was designed correctly and any errors we see in the report are related to the load you created in the test. In other words, I would like to talk about errors that appear because of performance problems, not anything else. If you are not sure why an error takes place, try running the test with same profiles and a smaller number of users, and see if the same problem appears.

First of all I should note that there are different types of errors.

  • HTTP errors. They are identified by the response code provided inside each HTTP response. Most requests are replied with the “200 OK” code, which means success. There are other codes requiring additional action from the client and codes that report errors.
  • Network errors. Any errors occurring on the socket level. Such errors appear in case of connectivity issues. For example, if you unplug the network cable during a test, this will produce network errors. When the tested server receives a high load that it cannot stand, it can start dropping connections producing network errors.
  • Timeouts. If the client does not receive any data from the server during a certain time period (120 seconds by default in WAPT), the corresponding request completes with a timeout error. Note that timeout can also occur as a network error, if the client cannot establish connection to the server because it does not respond. Such timeouts are detected by the system on the socket level. Both cases are very common in case of web site overload.
  • Validation errors. These are custom errors specified in your test. You can validate server response by certain keyword that it should (or should not) contain. Sometimes when a server receives a high load, it can reject requests with a user-friendly message like “The server is busy, please return later.” Such messages should be treated as errors in a load test.

In the HTML report produced by WAPT you can find the “Response codes” table. It contains information on different types of errors occurred in the test. For each code it provides the list of requests for which this code was produced at least one time. The numbers in the right columns are the numbers of pages and hits returned with the code for the request during the test.

errors_1

For example, let’s take a look at the following line:

errors_2

This means that “Profile1.page_1:…” request produced “200 OK” code one time for the page request itself and 32 times for all page elements of that request together with the page request. So, the table includes information about responses to page elements. For this reason it may list same request several times with different codes. For example, if a page request completed successfully, but its page element was not found on the server, it will be listed for 200 and 404 codes.

Note that response codes starting with “3” (like 302) are not errors. These are HTTP redirects that are processed by WAPT automatically. If you see the 404 code, you should check if the same code was returned when you originally recorded the profile. You can do this on the “Response processing” tab for the corresponding request. If you find same problem there, your site contains a broken link.

To get more information on each error you should take a look at the logs. Integrated log viewer provides the detailed information on all requests, responses, and errors appeared during the test run. This information is structured with help of a tree view that includes profiles, virtual users, sessions and requests.

Expand the “Logs” folder in the left view and select a session. In the upper right view you will see the log lines of different types.

  • Information messages like “Connecting to…”, “Local IP…” and any messages written to the log by JavaScript operators.
  • Page requests. Successful ones are painted green. Requests completed with errors are painted red.
  • Requests to page elements in grey color with indent under each page request. You can expand and collapse them.
  • “Values of variables” lines that provide information on the values of all variables used in the next request.

errors_3

You can select any line and see the details in the lower part of the view. For each request you can switch between different tabs containing request and response headers and bodies. This way you can analyze what exactly was sent to the server and received in response. For network errors you can get exact error code for each case.

There is a special toolbar under the left view that lets you navigate through the log. For example, you can get to the next error in the log by clicking a button.

errors_4

Note that by default logging is disabled for efficiency reasons. So, if you want to get logs after a test run, you should enable this feature on the “Log and Report Settings” page.

If you see that errors take place occasionally and there is no specific reason for each one except the stressing load, you can analyze how severe the problem is. For this purpose you may want to check error rate for different test phases. HTML report contains special tables for this purpose. This data is also provided on graphs.

When you analyze this information you should remember few important things. WAPT reports all error rates in percentage. For example, if error rate is equal to 50, this means that every second request completed with error.

Error rates are provided for page requests (pages) and pages together with page elements (hits). So, for example, if a page contains 9 images as page elements and 5 of them produce errors, error rate on hits will be 50% whereas error rate on page can be 0% provided that the page itself always loads successfully. In practice there can be any other ratio between these values. You only need to know that error rate on hits and on pages are two different values, you should interpret the results accordingly.

If you see that with the growing load all hits start producing more errors (growing error rate on hits), this probably means that web server or network capacity is insufficient. If you see that error rate on hits stays more or less the same, but error rate on pages grows, probably the bottleneck is somewhere in the application server and/or database.

Error rate is provided separately for each type of errors, but there is also a table with summarized values. This is also useful to see what the exact problem is.

Finally, different requests may have significantly different error rates. This is also very important information that can be used to identify bottlenecks. For example, you may see that error rate for the login request gets higher with the load, whereas all other requests produce same percentage of errors. This will give you a clue on which part of your web application requires improvements.

Posted in Testing practice, WAPT usage | Tagged , , | 3 Comments

WAPT Cloud: New benefits of our load testing solution

In the last days of 2013 we released a cloud version of our load testing solution. It is based on WAPT Pro, all extension modules and x64 Load Engines, so it is the most feature-reach and powerful combination of all the components we have.

This on-demand load testing solution is offered through the Amazon EC2 Marketplace. This means that with few clicks you can get the full functionality of WAPT Pro running on a virtual system instance in the Amazon Cloud. To do this you need to have an AWS account, however it is also very easy to create one. We provide step by step usage instructions right from our web site.

Some experienced users already know that all our products can be used in any cloud or virtual environment. So, technically this release is not a big step forward. With new cloud version it is easier to start and configure the product, but this is not the actual benefit. What really makes the change is the pricing for the new solution, which is now based on the hour rates.

For $5 per hour you can use a WAPT Cloud instance, which includes full functionality of WAPT Pro and all extension modules. You can also run smoke tests with up to 250 virtual users right from that instance. If you need a higher load, you can attach any number of Cloud Engines by launching additional instances of the corresponding capacity. We offer 3 types:

  • Cloud Engine 2k – up to 2 000 concurrent virtual users;
  • Cloud Engine 5k – up to 5 000 concurrent virtual users;
  • Cloud Engine 10k – up to 10 000 concurrent virtual users;

I think that there are two types of situations when our clients can benefit from this cloud offer.

  1. If you do not own any product licenses and need to run just a couple of quick tests, this solution is the best choice, because you do not need to purchase any permanent licenses and choose appropriate components. You can get everything you need and pay only for the time you use the product(s).
  2. If you have a WAPT Pro license and need to run a test with unusually high capacity, you do not need to purchase additional x64 Load Engine licenses, because you can use Cloud Engines instead. These engines are fully compatible with WAPT Pro (if you have the latest build of the product). Again, you will only pay for the time you use the engines. So, one hour test with 10,000 virtual users will only cost $50.

If your web application is hosted in EC2, you will have additional benefit by utilizing the fastest connection to it.

More information on the product and step by step usage instructions are available here.

Posted in General, Testing practice, WAPT usage | Tagged , | Leave a comment

How to setup SNMP monitoring of a Windows system

SNMP (Simple Network Management Protocol) is a network protocol that allows one device to query another device for information, change information on a device, or for one device to send a message to another device. It is widely used to monitor hardware and software components of web sites during normal operations or during testing. That is why advanced load testing tools, such as WAPT Pro, usually have ability to connect to any servers and receive performance counters data (such as CPU or RAM usage values).

Older versions of Windows, like XP, had SNMP service installed by default, so you only had to start it or enable automatic start. After that you could connect to that system with any SNMP client and monitor anything you needed.

For some reason Microsoft does not like SNMP. I do not know why. They think that this service is unnecessary even for server solutions, which looks strange in my opinion. In practice this resulted in harder configuration procedures for modern OS, like Windows 8 or Windows Server 2012.

The good news is that it still takes just couple minutes to setup, but you need to know where to click. Here is the instruction.

On Windows 2012 you need to open the Server Manager. If you are using Windows 7/8, skip to the next step.

snmp_1

Click the “Add roles and features” link.

On the followed pages click the “Next” button several times leaving the default choices until you get to the Features page. Check the “SNMP Service” in the list of features.

snmp_2

Click the “Next” button and “Install” button on the next page. The installation process will start.

snmp_3

When it is finished, close the window.

If your OS is Windows 7 or 8, instead of the above steps you can simply choose “Turn Windows features on or off” option from the Control Panel and select SNMP in the following dialog.

snmp_4

Now open the Services window. You can do this from Control Panel in any OS. If you do not know where to click, just type “services” in the search field and it will show you the link.

snmp_5

Double-click the “SNMP Service” item and specify the following settings on the Security tab.

snmp_6

To do this you will need to click the “Add…” button and add the “public” community.

If you want to connect to the SNMP service from the same system, you can do this now. If you want to access it from a different system, you need to do couple more steps to open SNMP port for incoming connections.

Open the Windows Firewall. You can do this from the Control Panel. Click the “Advanced settings” link in the Windows Firewall window.

snmp_7

Select the “SNMP Service” rule, the one that works for “Private, Public” profiles.

snmp_8

If you open the “Scope” tab, you will see that this rule initially allows access only for a list of IP addresses, but no addresses are specified. So, you can either specify the addresses from which you are going to connect or check the “Any IP address” option.

snmp_9

Now your SNMP service should work fine and it is available from other systems. Note however that if you use other firewalls, you should add the corresponding rule to them. SNMP work over UDP protocol and uses port number 161, so you should open it.

For example, if you run your system in Amazon EC2, you should create the following rule in the security group of your instance.

snmp_10

Posted in General | Tagged , , , | 3 Comments

How to setup Oracle monitoring in WAPT Pro

WAPT Pro can monitor the performance of database servers during the test. This is useful in case your web application uses a database running on a separate server and you want to check if that database can be a performance bottleneck.

Each database has a special table with performance parameters (such as the number of transactions completed per second, number of threads, etc.). To retrieve any specific parameter you need to execute the corresponding SQL statement. So, this is done the same way as any other data retrieval. The only difference is that performance parameters are calculated by the database server itself. You do not need to create the performance table before using data from it.

WAPT Pro has a number of predefined performance counters for MS SQL, MySQL and Oracle databases, which means that the corresponding SQL statements are already provided in the product. You only need to setup the connection to your database server from the system where you run the WAPT Pro workplace.

This is done through ODBC and usually it is very easy to configure… with one exception called Oracle. That is why I decided that the following step by step instruction will be useful for our customers. If you have an Oracle server and want to monitor its performance during the load test, this is what you need to do.

1. Download instantclient-basic-nt-11.2.0.3.0.zip and instantclient-odbc-nt-11.2.0.3.0.zip files from this page: http://www.oracle.com/technetwork/topics/winsoft-085727.html

2. Unzip both files to a folder, for example “C:\Oracle\”.

3. Run odbc_install.exe as Administrator.

oracle_1

4. Use any text editor to create the following file: “C:\Oracle\network\ADMIN\tnsnames.ora”. It should be a plain ASCII file with the following text:

ORCL =
(DESCRIPTION =
(ADDRESS = (PROTOCOL = TCP)(HOST = {server IP})(PORT = {server port}))
(CONNECT_DATA =
(SERVICE_NAME = {service name})
)
)

You should insert the proper {server IP}, {server port} and {service name} values. Default port number is 1521. You can copy service name from the same file on your Oracle server.

5. Go to Control Panel\All Control Panel Items\System and click the “Advanced system settings” link. On a different OS version the below dialog may be different, but this functionality should be present.

oracle_2

6. Click the “Environment Variables” button in the next window to get to the following dialog.

oracle_3

7. Add the following variables to the System variables section:
ORACLE_HOME = C:\Oracle
TNS_ADMIN = C:\Oracle\network\ADMIN

Append thethe PATH variable with the following path: “C:\Oracle”.

8. Since WAPT Pro workplace is a 32 bit application, you need to use the 32 bit version of ODBC. So, if you run it on a 32 bit OS, you can start the default ODBC from Control Panel. If you use a 64 bit OS, run the following file: “C:\Windows\SysWOW64\odbcad32.exe”.

oracle_4

9. Click the “Add…” button and choose “Oracle in instantclient_11_2” in the list. Click “Finish”.

oracle_5

10. Specify the parameters in the following dialog.

oracle_6

Data Source Name – Any name you would like to use for this DSN (“oracle11” in the example below);
TNS Service Name – select “ORCL” from the list.
Click the “Test Connection” button and enter the credentials.

11. In WAPT Pro choose the “Performance Counters” item in the left view and click the “Add…” button under the “SQL Performance” list. The following dialog will appear.

oracle_7

Specify DSN and credentials. Click the “Test ODBC connection” button, then the “Test…” button under the list of counters. If you experience any problem, please contact us at support@loadtestingtool.com.

Posted in WAPT usage | Tagged , , , | 4 Comments

How to analyze a load test report? Part 2: Test design problems.

When you start load testing a web site (especially if this is the first load test in your life) you may see a lot of errors in the report. Possibly you will even have to stop the test before it completes, because at some point in time it becomes clear that something goes wrong. If the problem is not so obvious, it is still recommended to check the report for the errors related to each virtual user profile (i.e. to each different type of virtual users) before looking at any performance data.

Usually you do not create a high load in the very first test of a web site, so if you see any errors in the report, most probably they appear because of the test design problems. In other words, the emulation of the real user activity is performed incorrectly. Your web application may produce errors and even refuse connections because it receives incorrect data from your load testing tool. Why this may happen?

analyze_report_2_21st problem. Most probably the errors appear because you have not parameterized the HTTP requests in your profile. Note that initially all requests are recorded as is. If you use a recorded profile without modifications, WAPT will simply repeat all the same requests with the same values of all parameters. However some values should be unique for each session.

There is no exact algorithm on how to find all places where the parameterization is required. WAPT can do some automatic parameterization, but only for standard cases. The remaining work depends on your web site, so you have to do it manually. At the same time WAPT provides a convenient interface for this task. So, the general approach is as follows.

After recording a profile click the “Verify test” button to verify it. The profile will be executed as is, without any modifications (except for the automatic parameterization made by WAPT). When the verification is finished you can check the “Logs” folder for errors and find the first request that produced an error. The goal is to find dynamic session-specific values inside that request. You can do this by comparing different sessions. Usually such session-specific values are contained inside the request parameters, but they can also be passed inside the main part of the URL. When you find such value you also need to find a place (the body of one of the previous responses) from which you can extract it. You can use the “Edit | Find and Replace…” feature for that.

In WAPT you can select any request and switch to the “Response processing” tab in the right view. Here you can see the recorded request and server response to it. You can add a variable by clicking the “Add” button near the list of variables. The goal is to specify how to extract all session-specific values from the server response and assign them to variables.

These variables can be inserted to the parameters and URLs of subsequent requests instead of initially recorded static values. That is how the parameterization works.

analyze_report_2_22nd problem. Let’s imagine that you have done good work on the parameterization and now when you verify your profile, it does not produce any errors, and each new session completes as expected. Now you try to execute a small test with several concurrent users, and you see that it fails for all users except the first one. The problem may be that your web site does not allow several concurrent sessions with the same user credentials. This means that you need to use a different user name and password for each virtual user. This can be done as described here.

After you make all necessary modifications to the profile you can enable the full logging (on the “Log and Report Settings” page in WAPT) to check that all user names and passwords are passed correctly. By default logging is enabled only for verification, but if you run test with just few users, you can switch to full logging without any significant performance overhead.

analyze_report_2_23rd problem. Even in case the user credentials are passed correctly, you may still see that almost all sessions complete with errors. This may be because some session-specific values still require parameterization, because they depend on the user account. Basically this is the same problem as the first one. I only wanted to note that you may face it again when you switch from one user to many users test.

For example, it may be that each user of your system has a special ID which is passed in some parameter of each request. If you use a different user name, you also need to change that ID. As usual the right value can be extracted from some response and assigned to a variable.

analyze_report_2_24th problem. In some cases you may verify a profile and find it good, but if you check again the next day it may appear that it does not work anymore and produces errors. This is a very common situation and the explanation is very simple: your profile contains session-specific values that become obsolete after a certain period of time. You need to find them and parameterize properly.
Each of the remaining problems is less common, but it is still worth mentioning about them.

analyze_report_2_25th problem. Your web application may require authentication. This is not exactly the same as entering the user name and password in some form on a web page and clicking the “Sign In” button. When you use a browser to access a site requiring authentication, it displays a separate dialog asking for credentials. Since this is done in a secure manner, it is not possible to record the credentials automatically, so after you finish recording your profile for such web site, you need to specify the user name and password in the profile properties. If you verify your profile without that, it will produce an HTTP error with code 403.

Note also that you may see HTTP responses with code 401 even after you enter the credentials. This is not an error. If a web site requires authentication, it always responds with that code expecting to receive the authentication data in return. When everything is done correctly, it finally ends with the “200 Ok” message.

analyze_report_2_26th problem. There is one very important rule that you should apply when creating a new virtual user profile: always start recording by entering the landing page URL into the address bar and always delete cookies and browser cache before recording. This is not just a good advice; this is the only correct practice.

If you start recording from the middle of a user session, your load testing tool will not be able to reproduce that session correctly. Even if you click a link on a page already open in your browser instead of manually entering the address, this can produce incorrect recording.

The same will happen if you do not delete cookies. Your web site may behave differently for new users and for returning ones. It may use cookies to restore the previous session. If you record such restored session, you will not be able to emulate a new one.

Finally, if you do not delete browser cache, all requests to cached elements will be skipped on recording. This is the least important problem, because any session-specific requests will be sent in any case, but to create a realistic load you will probably want to load page elements as well.

analyze_report_2_27th problem. In general it is supposed that load testing is performed after functional testing, however I know that not everyone regards this rule. Many people try to do both things in parallel and I have to say that sometimes it makes sense.

What I am trying to say is that if you see some error in the verification log, first of all you should check if that error was present in the initially recorded session. This can be easily done with help of “Compare with recorded” feature in WAPT.

In some cases AJAX requests complete with 404 or 5XX codes, but this is ignored by the client part of your web application, so you do not see any problems in the browser window. These requests may be obsolete and unnecessary for the correct work in general. Still it is preferable to remove them, but this is rather a small functional bug.

If you need to load test a web site with such “normal” errors, you can either delete those requests or convert them to page elements, so that they would not influence the session execution.

One final very important note. If you see errors in the report, you should definitely research the problem as described above. However even if you do not see any red lines in the log, this does not mean that everything works correctly. Your web site can produce errors in a “user friendly” manner or just redirect to a different page if it cannot provide valid content for a request containing incorrect parameters. This means that you need to read the actual response to see if it is correct. Again, you can use the “Compare with recorded” function and check all responses step by step.

Posted in Testing practice, WAPT usage | Tagged , , , , | 5 Comments