If you see any errors after executing a load test, first of all you should check if this is a test design problem. I wrote about the most typical problems of that kind here.
Now let’s suppose that the test was designed correctly and any errors we see in the report are related to the load you created in the test. In other words, I would like to talk about errors that appear because of performance problems, not anything else. If you are not sure why an error takes place, try running the test with same profiles and a smaller number of users, and see if the same problem appears.
First of all I should note that there are different types of errors.
- HTTP errors. They are identified by the response code provided inside each HTTP response. Most requests are replied with the “200 OK” code, which means success. There are other codes requiring additional action from the client and codes that report errors.
- Network errors. Any errors occurring on the socket level. Such errors appear in case of connectivity issues. For example, if you unplug the network cable during a test, this will produce network errors. When the tested server receives a high load that it cannot stand, it can start dropping connections producing network errors.
- Timeouts. If the client does not receive any data from the server during a certain time period (120 seconds by default in WAPT), the corresponding request completes with a timeout error. Note that timeout can also occur as a network error, if the client cannot establish connection to the server because it does not respond. Such timeouts are detected by the system on the socket level. Both cases are very common in case of web site overload.
- Validation errors. These are custom errors specified in your test. You can validate server response by certain keyword that it should (or should not) contain. Sometimes when a server receives a high load, it can reject requests with a user-friendly message like “The server is busy, please return later.” Such messages should be treated as errors in a load test.
In the HTML report produced by WAPT you can find the “Response codes” table. It contains information on different types of errors occurred in the test. For each code it provides the list of requests for which this code was produced at least one time. The numbers in the right columns are the numbers of pages and hits returned with the code for the request during the test.
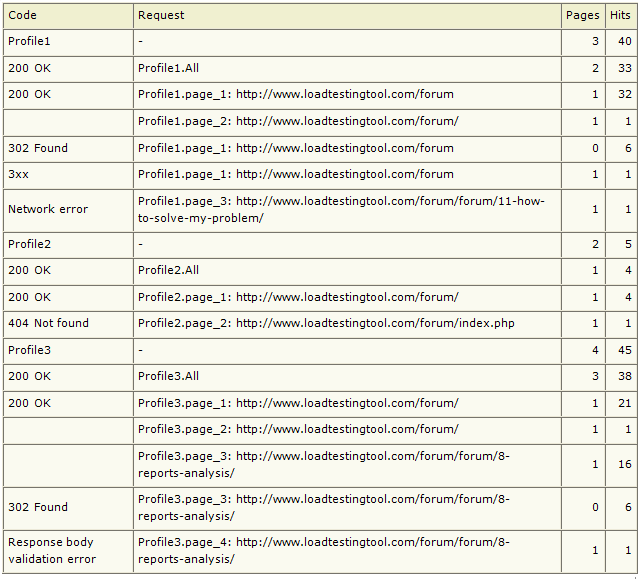
For example, let’s take a look at the following line:
![]()
This means that “Profile1.page_1:…” request produced “200 OK” code one time for the page request itself and 32 times for all page elements of that request together with the page request. So, the table includes information about responses to page elements. For this reason it may list same request several times with different codes. For example, if a page request completed successfully, but its page element was not found on the server, it will be listed for 200 and 404 codes.
Note that response codes starting with “3” (like 302) are not errors. These are HTTP redirects that are processed by WAPT automatically. If you see the 404 code, you should check if the same code was returned when you originally recorded the profile. You can do this on the “Response processing” tab for the corresponding request. If you find same problem there, your site contains a broken link.
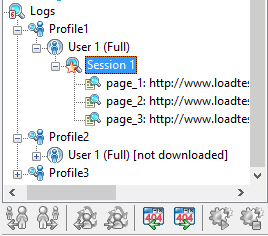
To get more information on each error you should take a look at the logs. Integrated log viewer provides the detailed information on all requests, responses, and errors appeared during the test run. This information is structured with help of a tree view that includes profiles, virtual users, sessions and requests.
Expand the “Logs” folder in the left view and select a session. In the upper right view you will see the log lines of different types.
- Information messages like “Connecting to…”, “Local IP…” and any messages written to the log by JavaScript operators.
- Page requests. Successful ones are painted green. Requests completed with errors are painted red.
- Requests to page elements in grey color with indent under each page request. You can expand and collapse them.
- “Values of variables” lines that provide information on the values of all variables used in the next request.
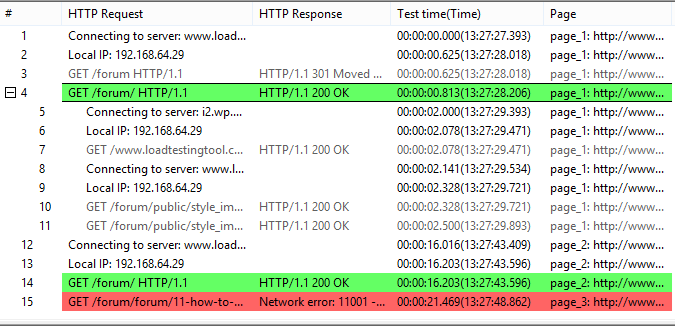
You can select any line and see the details in the lower part of the view. For each request you can switch between different tabs containing request and response headers and bodies. This way you can analyze what exactly was sent to the server and received in response. For network errors you can get exact error code for each case.
There is a special toolbar under the left view that lets you navigate through the log. For example, you can get to the next error in the log by clicking a button.
Note that by default logging is disabled for efficiency reasons. So, if you want to get logs after a test run, you should enable this feature on the “Log and Report Settings” page.
If you see that errors take place occasionally and there is no specific reason for each one except the stressing load, you can analyze how severe the problem is. For this purpose you may want to check error rate for different test phases. HTML report contains special tables for this purpose. This data is also provided on graphs.
When you analyze this information you should remember few important things. WAPT reports all error rates in percentage. For example, if error rate is equal to 50, this means that every second request completed with error.
Error rates are provided for page requests (pages) and pages together with page elements (hits). So, for example, if a page contains 9 images as page elements and 5 of them produce errors, error rate on hits will be 50% whereas error rate on page can be 0% provided that the page itself always loads successfully. In practice there can be any other ratio between these values. You only need to know that error rate on hits and on pages are two different values, you should interpret the results accordingly.
If you see that with the growing load all hits start producing more errors (growing error rate on hits), this probably means that web server or network capacity is insufficient. If you see that error rate on hits stays more or less the same, but error rate on pages grows, probably the bottleneck is somewhere in the application server and/or database.
Error rate is provided separately for each type of errors, but there is also a table with summarized values. This is also useful to see what the exact problem is.
Finally, different requests may have significantly different error rates. This is also very important information that can be used to identify bottlenecks. For example, you may see that error rate for the login request gets higher with the load, whereas all other requests produce same percentage of errors. This will give you a clue on which part of your web application requires improvements.

Pingback: How to analyze a load test report? Part 4: Response time.
Hello Ivan,
Please give me details about, how to trace error in log files.
Thanks & Regards,
Nikhil Kadam
Hello Nikhil,
If you mean errors that appear because of incorrect parameterization, you should use the following procedure.
After you record a profile, verify it and open the verification log. Browse the log step by step and check if you get expected response for each request. WAPT Pro will let you compare requests and responses with the originally recorded ones.
First of all you should check for errors. They are marked red in the log, so you can easily navigate to the problem. Note however that in many cases an error is produced not exactly by the request that requires additional parameterization, but few steps later. So, if you see an error, you should check the preceding requests one by one.
Not all errors are reported by HTTP codes. In most cases if you see a response significantly different from the initially recorded one, this also indicates a problem that you should treat the same way as an error.
If the structure of the response is preserved, but it contains different values, possibly these values can be found in subsequent requests and you need to parameterize them. You can use the “Find and Replace” dialog to check this.
After you make corrections to the profile you can verify it again. This way you will parameterize all session-specific values step by step until you get the fully correct emulation.
Regards,
Ivan