Let’s suppose that you have already resolved all problems related to unexpected errors in your test. I mean that your site may produce some errors on heavy load, but the emulation of the user sessions is performed correctly and the error rate is acceptable. If this is not the case, or you have any doubts, you may want to read my earlier posts here and here.
If the errors are not an issue, your next step is to look at the most evident indicator of the application performance – its response time. This term initially refers to a time required for your application to respond to a user action. This looks very simple, but you should keep in mind the following things, if you want to analyze the test results correctly.
1. Different actions can have significantly different response time and provide different load on the system. For example, if you search a document by a keyword, your application sends a query to the SQL server. This may take much more time than retrieving a document by its ID or clicking a menu item. That is why it is more important to check response times of critical actions.
2. Each user action in a load test is represented by one or several HTTP requests. So, instead of considering time required for a response to a user action, we always consider time required to reply to a certain HTTP request. Load testing tools do not render pages received from the server. This would require too much system resources and would make it impossible to emulate thousands users on a single system. That is why we do not measure any client-side parameters, such as rendering time. We only measure the time required for the server side of your application to react.
3. Each page request can be followed by a number of additional requests that retrieve page elements, such as image files. Depending on what exactly you want to check you may need to monitor time required to receive all these elements. WAPT provides both values in the report: total time with page elements and response time for the main page request only. The latter may be important, because it is usually in better correspondence with the performance of all application components. Static page elements retrieval only depends on the web server and network performance.
Note that the page elements for each request are specified on the corresponding tab in WAPT.
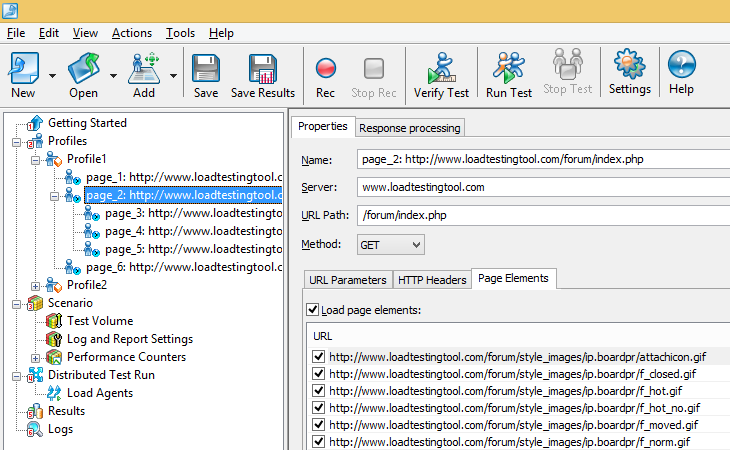
Response time with page elements is provided in the report near the main page response time in parentheses.
4. You may want to check time required to execute several successive requests. In WAPT you can do this by joining those requests with help of the Task operator. There are two options for the calculation of task time shown below.
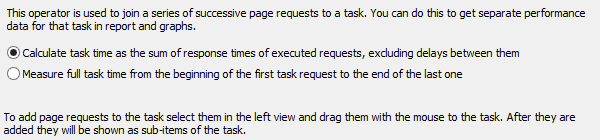
Task times are provided in a separate report table.
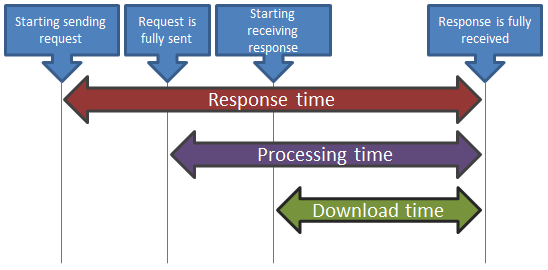
5. In general, response time may have several different interpretations depending on how exactly the time interval is measured. In WAPT this term (response time) stays for the time interval that starts on sending the very first byte of the request and ends on receiving the very last byte of the response. There are two alternatives. Download time is measured from the first byte of the received response to its last byte. Processing time is measured from the moment when the request has been fully sent to the last byte of the response.
6. If you compare response times for the same HTTP request in different user sessions, you may get significantly different values. So, if you monitor response time in a test with a big number of concurrent sessions, in each time interval you will have many response times for the same request. How to analyze this data? The most usual approach is to calculate the average response time. The drawback of this approach is that it can create a wrong perception of the site performance in case of an unusual distribution of the received values.
A simple example: consider the following set of values: { 1, 2, 3, 110, 2, 2 }. Average value is 20. However this is not a “typical” value from the set. It would be more natural to say that the set consists of values close to 2, but also contains some occasional big numbers like 110. So, besides the average value you may also want to check the minimum and maximum values.
Finally, there is one important value, which is called Avg90. It specifies the upper bound for 90% of all values from the considered set.
For example, let’s consider this set: 1, 2, 3, 4, 5, 6, 7, 8, 9, 10.
Simple average value = 5.5, Avg90 = 9.
If you want 90% of all requests to complete in N seconds or faster, Avg90 should be smaller or equal to N.
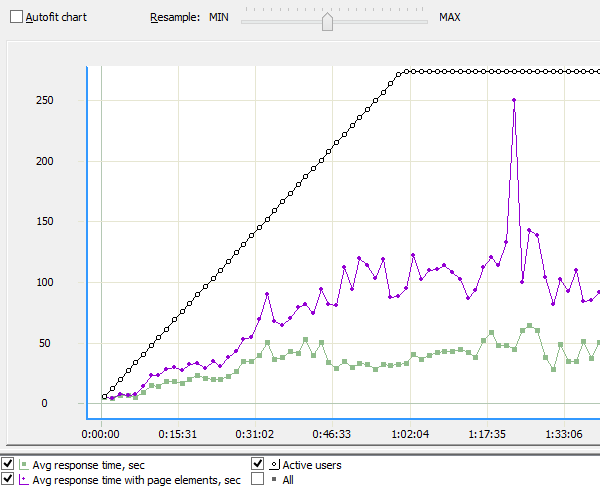
7. To check the performance of your web application you should see how the above mentioned values change over time with the growing load. This means that you will need to consider the averaged values for several time intervals. In each interval the number of concurrent virtual users should be different.
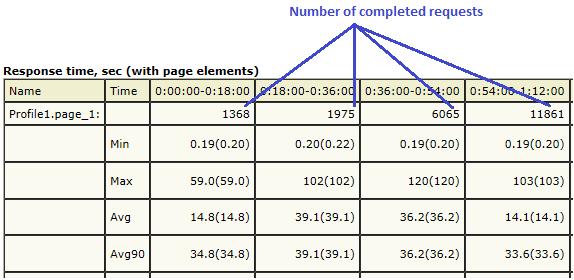
It is important to consider big enough intervals. Otherwise you will have to take into account values calculated basing only on few results. One occasional spike can dramatically change the picture. WAPT provides the number of request completions for each test phase in the report. You can see it in the “Response time” table on the same line with the request name.
Also, each graph has a special “Resample” slider that lets you adjust the interval length.
Conclusion. You need to take into account the architecture of your web application and select a set of valuable response time parameters. Such set should let you estimate the performance of each component of your application as well as the overall system performance. The final goal, however, is to estimate how each of these parameters change depending on the created load and check that they all remain within the allowed range.

Hello,
thanks for the good article.
please help me to figure out how to measure the time interval (response time, downloading time, and processing time) from the table (Response time with page elements) ?
thanks in advance,
Hello Sarah,
Download and processing times are only provided on graphs.
As for the response time, you can find it in the report (with and without page elements).
Regards,
Ivan
shouldn’t Avg90 = (1+2+3+4+5+6+7+8+9)/9 = 5?
Avg90 is such a value that 90% of all values from a given set are smaller or equal to it. It is like a bound separating 90% and 10% of all values.
Nice article ..
You mean if I consider only 90%Line as response time from aggregate report , that is valid response time for respective request.?
If you mean Avg90, this is a calculated value that is used to estimate the maximum response time for 90% of all users.
If you need to estimate average time, it is better to look at the Avg value.
thank you Ivan …
Sorry I didn’t mentioned that ..actually I am using Jmeter for performance testing.
In Aggregate report –
Label,Samples,Average,Median,90%Line,95%Line,99%Line min,max,Error%,Throughput,KB/sec
this data is getting
So I want to check response time of request ,for that which time should I consider?
I am not as familiar with JMeter as with WAPT, but I believe that each number has its own meaning. Usually average time is of most importance, however this depends on your requirements.
Ok ..Thank You
I have question related performance testing process.
Actually I want to check only response time of each request, so is it necessary that I should run script with more than 3 user?
Your web application can slow down when accessed by multiple users. So, average response time with 1000 users may be different from the average response time with 10 users. That is why you should run load tests with the same number of concurrent users you expect in real life scenario for your application.
Hi Ivan ,
m facing problem in result analysis .
Result I got from aggregate report is not matched with browser response time (using chrome developer tools->network)
So Is there anyway to validate report?
Thanks in advance.
Hello Priya,
First of all, if you compare averaged time from WAPT report with a response time in a separate session, you can get different results. This is not surprising.
Note also that WAPT does not render pages that it loads. This would require too much CPU resources for multiple users. So, you can compare WAPT time only with the corresponding time from the browser, the one that does not include rendering.
Regards,
Ivan
Hi,
I’m a beginner of WAPT and I run the test with 100 fixed user and I want to know the avg response time with page element. Which one I need to check? Avg response time under summary or avg or avg90 under response time. I’m really confuse.
Thanks in advance.
Hello Mavis,
I recommend checking Avg response time for each request in the Response Time table. The one with page elements is provided in parentheses.
Regards,
Ivan