Software performance testing at educational institutions

A recent study of our clients has revealed an interesting phenomenon: the number of universities, school districts, training centers and all other types of commercial and non-profit educational organizations is disproportionally high among the users of our load testing tools.

Such bias is hard to explain given the fact that the demand for performance testing tools and services is hardly smaller in other industries. Geographical spread of such clients is also very wide: from major universities in US to Australian and Asian academic institutions. This cannot be a result of our targeted marketing campaigns, because, frankly, we have never pictured our primary users that way. These customers could not have been attracted by any marketing strategy, except possibly word of mouth. This makes me believe that the phenomenon is a kind of natural, resulting more from the features of our tools than from the channels we use to distribute them – a remarkable exception in today’s business world.

With this conjecture in mind let me dig a bit deeper for a convincing explanation. Why do universities care about the performance of web applications at all? This is simple: web resources are increasingly used in the educational process not only as training tools and sources of information, but as a means of organizing and planning student activities. Such applications often utilize highly customized workflow, they may require updates to be done every semester or year and are quite liable to uneven demand with periods of intermittent high load.

Those conditions perfectly describe a situation when one needs to design and run load tests on the regular basis. The key point here is that the IT department at a university is likely to face the need to create new tests often enough. This is opposed to running the same test with small modifications again and again checking each new version of an application. In general, WAPT is applicable for both scenarios, but its ease of use on the test design stage provides more benefits in the first case. It does not require someone to become a dedicated professional in the area. In many cases WAPT can be successfully used by a person with only basic technical background, which may be a useful option for organizations with limited IT stuff.

Continuing the analysis of the usage patterns and the recent trends in the performance testing it is hard to overlook the emergence of online and cloud solutions. Those have widely replaced classical tools installed and run on-premises. Their on-demand availability and pay-per-use licensing model look tempting. However there are at least two reasons why such novelties are less applicable for the clients we are considering here. First, universities often host web applications locally and sometimes even inside a local restricted network. Second, while it may be cost-efficient to pay few dollars per test, such expenses are hard to plan and control, especially over a long period of time.

Business users with ever changing strategies and tight release schedules can instantly assign budgets for urgently required services. Very often they simply do not assess longer term implications and choose options that let them resolve present problems most efficiently. In a year they may find themselves in a completely different state and environment. In three years some of them will no longer exist. Universities have longer lifespans, sometimes hundreds of years. That is why WAPT pricing model with one-time initial license cost and relatively small annual payments to keep the subscription active is probably more comfortable for such clients. It does not limit the number of tests and the number of users of each product installation. So, the costs are both affordable and predictable.

Finally, one interesting thing is that WAPT has become a subject of IT courses at a number of colleges, where it serves as a working example of a performance testing tool. The free demo version can be easily utilized for that purpose, but if a more realistic experience is presumed, we are always ready to address the need for numerous installations with volume discounts.

The above observations may explain the popularity of WAPT in academic circles. I totally agree to leave the final judgment regarding the accuracy of my evaluations to the reader. In any case we are happy and proud to have so many education institutions as customers and we would be even happier to see their number growing.

Posted in General, Testing practice | Tagged , , , | Leave a comment

WAPT Pro 5.0: Small features making big difference

We released the latest versions of our load testing tools few months ago. All users who have had an opportunity to update their product installations already know that two major features in that release were the support of HTTP/2 protocol and the ability to execute concurrent requests in each user session. In fact, each of those features is a complement to the other one, because the development of HTTP/2 was inspired by the idea of concurrency in the first place.

Yet, it is true that not every web application has switched to the new version of the protocol by now. So, what if your test project does not require any of these major features? Will you get any benefits after upgrading to WAPT Pro 5.0 from the previous version of the tool? Yes, you definitely will, and I am going to show you why. I will briefly list some new features that I find most useful in the latest version of WAPT. However small each of them may seem by itself, together they make the new version of the product more user-friendly and easier to use, which means faster test creation and more accurate results.

Multiple encoding schemes

Let’s start with the most long-awaited one. As you know, when special characters appear as a part of an URL or inside the parameters of HTTP requests, they must be encoded, i.e. replaced with the “%”-codes. Unfortunately, different servers apply slightly different encoding rules. For example, in some cases the “@” character is encoded, but sometimes it is passed as is.

That was a big problem with all previous WAPT versions, because they applied only most common encoding scheme. Wherever a different rule was used, WAPT treated that as a non-standard encoding and did not decode such values leaving them in the poorly readable encoded form. It could not apply automatic parameterization to such values too.

Now you have a choice of encoding schemes for each parameter, and best of all, the right option (or the most relevant one) is selected automatically on recording.

Page resources as sub-requests

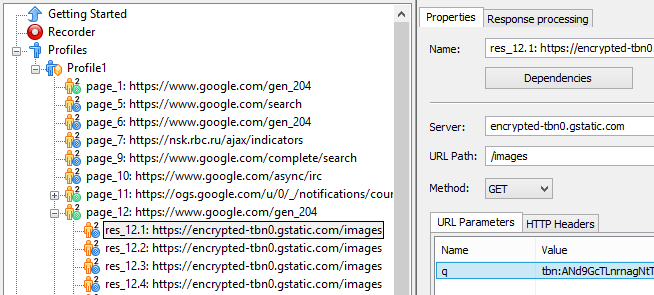
What was regarded as “page elements” in the old version is now renamed to “page resources”. They are shown as sub-requests in the left view and each of them has almost all properties of a regular request. This makes them easier to parameterize.

Besides that you can now clearly see which page requests have additional resource requests associated with them and which do not.

Status bar information

If you select a profile or a number of requests inside it, you can now get cumulative information on the selection in the status bar. This way you can assess which part of the profile is lighter or heavier in terms of response size, number of variables or time it takes to execute.

POST requests with green icon

Usually only a small number of requests in a profile use POST method, yet those ones are most important, because they actually post data to the server in order to perform a transaction. Now they are not lost among other numerous routine requests and can be easily spotted by the green icon.

JavaScript test button

The easiest way to insert a JavaScript code in a profile has always been the JavaScript operator. However to check the result of the code execution one would need to verify the whole profile and review the log. That turned the code debugging into a nightmare. With one elegant change we have just fixed that by upgrading the functionality of the “Test” button located next to the code view. Now it does not only perform syntax check, but actually executes the code taking the original server responses and variable values for the context.

This is now similar to the work of that button in the function specification dialogs.

Variable calculation on each redirect

Redirects are processed by WAPT automatically and you very rarely need to intervene in that process. This is only required when you need to get a value that is only available in the intermedium server response. This may be an ID passed as a part of the “location” header identifying the new URL to follow. In the old versions the only choice to handle that was the option not to follow redirects. The use of that option, in turn, required you to add the redirected request manually and parameterize it.

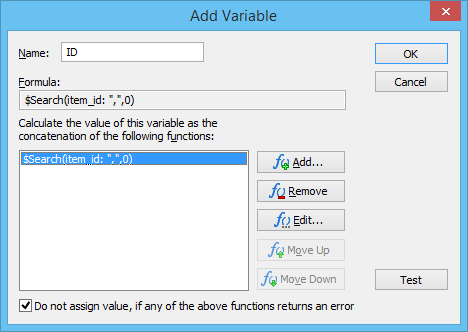
Now you can extract data from intermediate responses the same way you do this with the final one, i.e. with help of functions accessing the response body and headers. This is because all variables defined on the “Response processing” page are now calculated and reassigned on each redirect. In most cases this results in final values being extracted from the latest final response, however if you look for a value that can only be extracted from an earlier response, you can also choose not to reassign it in case the function returns an error.

This will make the latest correctly assigned value final.

Referrer header specification

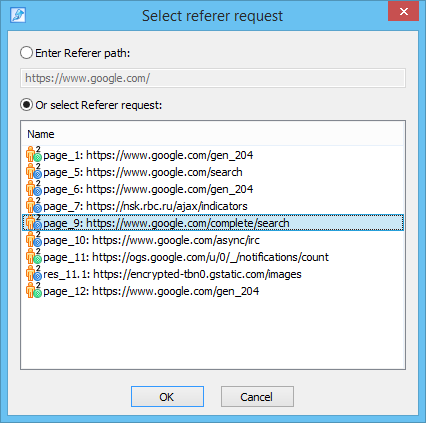
The “referer” header is very rarely regarded by the server, meaning that in most cases you can supply any value in it and get correct response. Yet, in some cases you do need that header to be correct and carry exactly the value expected by the server. That is why now that header is not created automatically basing on the URL of the previous request, but stored in the profile and can be redefined manually. When doing that you do not need to use variables for the parameterization. Just select the right request from the list and WAPT will insert session-dependent URL of that request automatically.

Much faster and more informative logs

Even though it is not recommended to enable full logging for large tests, in some cases the ability to do so is crucial. And if you do this for a reason, you expect to have all the means of browsing through the logs and getting all the useful information from them. So, the fact that in the latest version the log viewer works times faster is good news for such scenario.

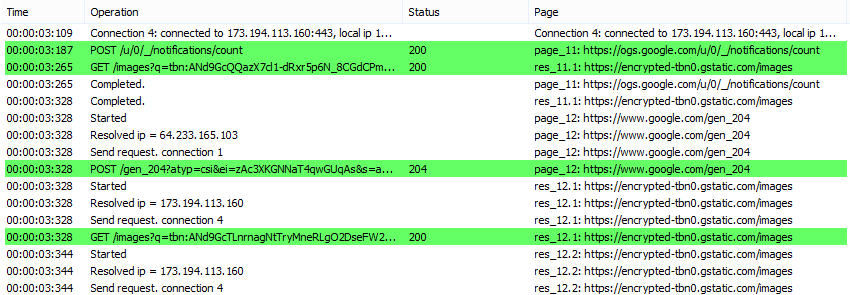
If you only use logging for verification and small tests, you do not need extra efficiency, but you still can benefit from a better structuring of information and additional details, like breakdown to the level of connections, streaming chunks and separate WebSocket messages sent or received.

Clickable link to logs from the verification report

Finally, there is a feature that will save few seconds of your time on each test verification. Now in the verification report you can click any request to open it instantly in the log. Simple as that, but imagine how this adds up to hours of work saved over the whole period of test debugging.

* * *

Since the original release we have created a number of updates fixing all the little flaws unavoidable in any newly redeveloped software. So, even if your usual strategy is to stay away from fresh versions for the sake of stability, now it is time for you to update safely enough. Note that if you install the new version on the same system with the old one, they will not conflict with each other. This will let you use both versions for the transition period while you are converting your current test files and getting accustomed with the new features.

Posted in General, Testing practice, WAPT usage | Tagged , , , , , | Leave a comment

WAPT Pro 5.0 beta: HTTP/2 with true concurrency

We have been working on this for quite some time. Now a new version of WAPT Pro is about to appear, and this time we decided to start with releasing it in beta. Even though the tool GUI looks almost unchanged, all parts that actually do the work (test recorder and load generation unit) have been completely rewritten. This was not done just to squeeze out a few percent of performance or because the old code was bad. It was very good for executing user sessions consisting of successive HTTP requests. This concept is still applied by the majority of the load testing tools, but we wanted to become the true concurrency pioneers.

The idea was initially inspired by the advent of HTTP/2, which features concurrency within a single connection by design. However what is now so easily done with HTTP/2 was actually possible to do with the earlier version of the protocol, but required opening multiple connections to the website. This was widely criticized as a very unthrifty approach, yet browsers started utilizing concurrent connections to speed up page load more than a decade ago. This was silently ignored by the vendors of the performance testing tools, because this was something really hard to implement with required efficiency and without complicating the test specification. Couple years ago we added the ability to use concurrent connections for page elements in WAPT Pro 4.0, but we could not get further at the moment.

Now we are ready to make the next step and introduce WAPT Pro 5.0 capable of executing concurrent requests within each user session. This essentially means that it creates true browser emulation with either version of HTTP protocol. Only few other tools can presently do this, but it will require programming skills form you to implement concurrency in them. With WAPT this is as easy as usual: just record and run.

We have not scheduled the official release yet, but beta versions of WAPT Pro 5.0 and x64 Load Engine are already available for download.

If you are using a previous version of WAPT or WAPT Pro, you can install the above versions on the same system without inducing conflicts. Extension modules are compatible between versions. Any active WAPT Pro 4.x license is applicable for the new version. This upgrade will be covered by the license maintenance, so you will be able to switch at any time free of additional charge.

You are welcome to report any problems and send comments regarding new version to our support address or use the “Ask for assistance” feature in the tool to upload your test files to us. We will be happy to hear from you as usual.

Posted in General | Tagged , , , | Leave a comment

Why WebSockets gain popularity?

Web applications are becoming more and more interactive. They do not resemble static web pages anymore. That is why they require functionality like instant messaging, user status updates, real time data view, peer to peer interaction, etc. Until recently, the most common way of such communication was polling via HTTP – the most simple but not very effective way, and here is why.

  1.  Server cannot message a user directly, it can only process and respond to client’s request. In order to receive updates the clients are sending requests all the time. And in most cases the server responds “nothing new”. The server is loaded with those numerous iterations without any useful information being actually transferred.
  2. HTTP allows client requests and server responses go only in successive manner, one after another.
  3. HTTP requests and responses include headers that may very long, if cookie values are passed. They are transferred with each request and response and do not carry any useful data.

As the result the communication is not instant, and we have sufficient server load which grows dramatically for large amounts of users and my collapse the application. There were attempts to solve these problems, but these were rather patches and hacks then truly elegant solutions.

Long Polling was aimed at reducing the number of request-response iterations. Unlike traditional polling, user request has a timeout, staying open for certain time. The server responds to this request only if an event happens. If nothing happens during the given period, the server responds closing the request. Then a new request can be issued. From the client side, events happen almost in real time, but slight delay may happen between requests. For the server, this reduces the number of request-response iterations, but the problem with redundant headers remains. Also, long polling requires sufficient memory to keep a number of idle connections – one for each user.

Server-Sent Events protocol works in a similar way to long polling, but the connection stays open even after an event is sent to user. This reduces server load, but the connection is one way, which is fine for displaying changing values, but is not sufficient for messaging.

WebSocket technology was introduced in 2011 and became a breakthrough. Unlike the other solutions it provided bidirectional, full-duplex communication between server and client over a single TCP connection. WebSocket does not require the request-response routine, allowing both client and server message each other instantly after the initial handshake. Each message is framed with just 2 bytes instead of bulky HTTP headers. Client and server can talk independently, each able to send and receive information at the same time.

As you can see, with WebSocket you have no redundant requests and responses and no extra load, only necessary bytes are sent. This reduces delays and server load vastly, allowing web applications to perform modern tasks in the most effective way.

The WebSocket protocol is currently supported by most major browsers, including Google Chrome, Microsoft Edge, Internet Explorer, Firefox, Safari and Opera. So there are no compatibility issues. And this makes it the best universal solution to date.

Posted in General | Tagged , , , , , | Leave a comment

Why go with SoftLogica

When I speak to our CEO, who is in charge of our marketing processes, he keeps telling me that there are too many vendors like us in the IT world, and we desperately need to differentiate somehow to be spotted by anyone out there.

The “try before you buy” concept does not work anymore. Trying something is an exhaustive task. People cannot oblige themselves to toil that much. Worst of all, even after you’ve tried a lot, you may still be uncertain if that was a good experience or not.

That’s quite disappointing, of course, because we used to get quite positive impressions from customers who took time getting familiar with our tools. However, instead of lamenting further about recent shifts in customer behavior, I am going to send a straightforward message to the hesitant minds.

Below you will find the exact reasons why choosing us for a performance testing project is a wise decision. Just to clarify: this is not about why we are just good. This is about such features that other vendors simply cannot afford providing.

  1. Try to find another company that allows reporting technical problems and feature requests directly to a decision maker. Yes, I mean myself. And many of our customers know that this is not a mere polite conversation about future versions. Sometimes new functionality is added to the products within days, not to speak about bug fixes.

  2. A personal build with a fix provided in one day. This is not a miracle. This is how we work with issues reported by our customers. It can take longer ONLY if we cannot reproduce the problem, or it requires more coding time. The latter is quite a rare case. There are no permanent “known bugs” in our tools. This term is a complete nonsense for us, because if we know a problem, fixing it is the top priority.

  3. We provide technical support on the general functionality of our tools. This means that you can ask any questions on how any feature works and get an answer in one business day (in fact, usually much sooner). In practice we go far beyond that and help customers create tests and interpret test results. We never suggest go reading help topics when asked questions. Our support goal is to familiarize users with the tools and help getting real results out of their work. Of course, we cannot repeatedly do all the work for our customers free of charge, but if you ask me how to parameterize a certain value in the test or what a number means in your test report, I will not reply with a price quite for that. If the question can be answered basing on the quick analysis of the customer data, we just do that fast and straight.

  4. There are easy problems and there are hard ones. Sometimes we face situations requiring really sophisticated test design. However there are no unsolvable problems for us. We never leave customers alone with their challenges gracefully evading complex tasks. On the opposite, we like to be involved and work on the test implementation together with the customer. This does not mean that we charge for the full testing service in such cases. And this is where we are different: if you need help with a specific issue, we deliver the result as fast as we can (usually in 1-3 days for single session emulation) and charge fairly for the work done. No task can be too small or too big for us.

  5. In case you hire us for a complete testing service, you don’t have to be an IT guru to understand the report we create after running the test and analyzing the results. This will not be just an output of the testing tool. We will describe all our finding and conclusions in clear and comprehensible form. Moreover, you will be able to re-run all the tests by yourself, because our testing tools are easy to use even for a nonprofessional. The hard part is the test design, but this is a distinct task, and we can always do it for you. Finally, after creating tests, we can provide additional specification on the test implementation for your own QA team. This will let you create similar tests in the future without our help. We do not keep know-how and make you pay us again and again. We want you and your team to get as much benefits from our service as possible.

In essence, this is how we work here at SolfLogica. If you like that approach, we will be happy to see you among our customers.

P.S. Let me know, if I overstated anything… looks like we are too perfect, which is not exactly my style.

Posted in General | Tagged , , | Leave a comment

Testing of a website behind a load balancer

When you plan a load test, one of the first things you need to know about the backend configuration is if it includes a load balancer. This is important because most load balancers distribute new user sessions by the client IP address. Some of them allow changing the distribution method. However this may be achievable only by a significant configuration change. You will hardly persuade the site admins to make such changes in the production environment.

What is a bit embarrassing in this respect is that even if you select the “distribute to the least loaded” option in LB settings, this may still mean that it will use this rule only for new IPs. After the initial connect, each IP is remembered for a certain time (from 1 hour to few days) and all new connections from the same IP will be directed to the same web server.

This creates a very big problem for load testing. If you use WAPT Pro, or any other efficient load testing tool, by default all your virtual users will share the same IP address and will be directed to the same web server behind the LB. As a result, you will not be able to test the whole system correctly.

There are several possible solutions. The first one is to setup several IP addresses on the system running load generation unit and use IP spoofing feature available in WAPT Pro and similar tools. Another solution is to use several systems for the load generation. Each of them will have a different IP. In both cases we will have all sessions coming from N different IP addresses.

The most common mistake in this situation is to think that if you need to test, say, 5 web servers behind a load balancer, you can just run the test from 5 different load agents. Unfortunately most likely this will not work, because nobody guarantees that two agents cannot be distributed to the same server. As a result, most likely you will not load all your 5 servers this way. Moreover, after you run your test for the first time, your LB will most likely remember the distribution of IP addresses, so next time it will distribute all agents to the same servers. Even if you can change all IPs and try again, this will hardly be useful.

For some reason people think that when you run 5 agents to 5 servers and they all are distributed randomly, there is a good chance that each agent will be directed to a different server making this a one to one distribution. Let’s introduce some math to this. Remember the probability theory? The first agent is distributed to the first server. This is always a success. The second agent should be distributed to one of the remaining servers to make the whole thing work. The probability of this is 4/5. It is 3/5 for the third agent, because this time 2 of 5 servers are already occupied. If we continue this observation for the remaining load agents, we will have the following formula for the total probability of success:

1 * 4/5 * 3/5 * 2/5 * 1/5 = 0,0384

Unfortunately this means that you have less than 1 chance out of 25 to get the one to one allocation.

The right solution is to “unrandomize” this process. By default the load balancer will distribute each new IP to a least loaded server. However a difference in load produced by a single user session will hardly be regarded. We can archive our goal if you create a significant number of sessions from the first IP address, then start adding sessions from the second IP and so on.

WAPT Pro offers two ways to achieve this.

  1. You can assign each virtual user profile to a specific load agent and specify a certain delay for each profile, so that they would be started one by one, but not at the same time.
  2. You can start the test with a single load agent and add other ones with some time intervals during the test. This can be done from the “Current Load” page that appears in the left view after you run the test.

If you perform the above procedure accurately, LB will remember all the IPs, so you will not need to repeat this again, if you want to restart the test. The created one to one allocation will be preserved and you will be able to test the LB and the site behind it.

Posted in Testing practice, WAPT usage | Tagged , , | Leave a comment

Load testing of HTTPS web sites

As you probably know, the percent of secure HTTPS web sites is growing every day. Moreover, even if you do not care about security, the latest news from Google suggests that you will have to move to HTTPS in any case, because otherwise you will see your site dropping down in search results.

Depending on the implementation of your site, switching it to secure connection may take from few minutes to few weeks. You may face functional problems, broken links and thigs like that. Imagine that after you have done everything required, you finally see your site working under the perfect green line of the browser address bar. The question is: what have happened with the site performance, and should you load test it again?

The answer is yes, because of three reasons. First, the data sent over SSL connection must be encrypted. This is done very fast, but still requires additional CPU resources in comparison with unencrypted HTTP, especially for sites with mainly static content. Second, SSL handshake takes additional time and resources. If, for some reason, the connection is reopened frequently, the impact will be higher. Third, some components of your application may start working differently after the switch. This refers not to the web server only. Even though in most cases this problem does not take place, you still need to load test the site in order to make reliable conclusions.

The next question is if you can apply the same tests with just the protocol type updated? The answer is: “yes, but this is not recommended”, which actually means “no”. The reason is that you will have to update too many places, because sometimes URLs are contained inside the POST data. Even if you do this work carefully, you cannot be sure that your application sends exactly the same sequences of requests as before. So, it is very much recommended to remake the tests.

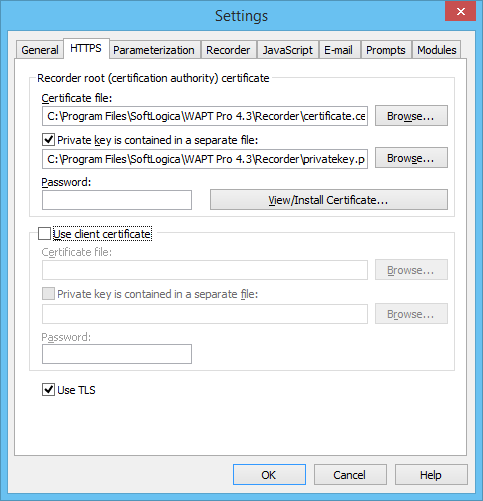
If you never tested HTTPS sites before, you may face new problems while recording your tests. The problem is that when recording, WAPT works as a proxy between your browser and the target site. This is easy when the information is passed unencrypted. However the purpose of HTTPS is to make it impossible for anyone in the middle to read the encrypted information. How WAPT can do this? It actually has to decrypt and encrypt it again. The browser thinks that encryption performed by WAPT is done by the site. The site, in turn, thinks that it gets data encrypted by the browser. This is possible only in case your browser trusts WAPT as a highest authority. You can make it do so by adding WAPT recorder certificate to the system store called “Trusted Root Certification Authorities”:

By default, WAPT will try to install that certificate automatically. It will prompt you for that when you try recording an HTTPS web site for the first time. You need to have administrative rights on the system to complete this process.

You can also do this manually from the Setting dialog. Click the “View/Install Certificate…” button for that.

If certificate is installed properly, your browser should treat the connection as secure and you should be able to record the site without problems. The good news is that everything else is done for HTTPS sites exactly the same way as before.

Posted in Testing practice, WAPT usage | Tagged , , | Leave a comment

WAPT 9.3 and WAPT Pro 4.3

Last week we released updates to our products, so it’s time to make some notes on this in addition to the official information, which (as usual) can be found on our site. In fact, I recommend taking a look at the list of new features before reading further.

I would not say that we introduced anything to change the world of load testing, but few of the additions put us ahead of our competitors, which is definitely good. Let’s get to the list.

1. Adjustable test environment

This basically means that you can add or remove load agents during the test. Why anyone would need to remove an agent from the test? You can hardly read this in any official press release, but the answer is: this can happen by itself if an agent crashes or disconnects for any reason. Well, you know, this is not quite a frequent case. Our software is stable and agents usually work days and weeks without such problems. However what if you run a long test and get a short network glitch? With previous versions you would need to restart the whole process. Now the workplace will simply reconnect to the agent after it becomes available and the test will continue.

I will not describe all other situations when you may need to add or change the agents. This is more or less obvious.

2. Ability to change load parameters during the test

We all like experimenting and managing processes on the fly. That is why it has always been boring to restart the test every time when you wanted to increase the load over the initially planned volume. Now you can change the number of virtual users for any profile without stopping the test and see what happens with your site after that. Remember that all charts are also working in real time, so the process has become far more exciting with this new feature.

3. Module for SharePoint testing

One more popular framework is now in our list. The module parameterizes request digest values during recording of profiles. Those values can be contained in a number of placed within the server response and the module “knows” them all. So, you do not need to look for the right function to extract that value and do this manually for every request. This is all done with the new module-enabled function and everything is added to the profile automatically.

4. Extended log analysis features

The ability to compare logged requests and responses with the originally recorded ones is the key debugging feature for any load testing tool, because if anything goes wrong, you need to know what exactly causes the problem, and if you suspect that some value is session-specific, you should be able to check this quickly.

Two things have been improved in this release. First, the algorithm used to compare pages has been replaced with a completely different one, which is more accurate and works much faster. You may remember the compare screen remain frozen for minutes on very long pages. You will not see this anymore. The second thing is the two additional tabs that let you see the headers and cookies all sorted out. You can compare them side by side in the list, not as plain text.

5. Improved error logging option

I have to say that error logs have been a pain from long ago. The problem was that when you see only errors and nothing else, you will hardly understand the reason of those errors. Fortunately, you could enable full log for the first user and check its sessions in case they contained the same errors.
Now error logs contain full logs for failed sessions. This lets you track each failure from the very beginning. You can also enable full log for the first user to compare such sessions with successful ones.

6. Support for SNMPv2c performance counters.

I can hardly add anything about this feature. Some servers are configured for this specific version of SNMP and we simply had to support it. Looks like we now have full coverage for this protocol.

Posted in WAPT usage | Tagged , , , , , | Leave a comment

Response validation with JavaScript code

One of the benefits of the Pro version of WAPT in comparison with the regular one is that you can insert JavaScript code inside profiles to handle various calculations. This can be used to parametrize complex user sessions when session-specific values are not contained in the response page code explicitly. Another example is when you cannot extract values from the response with help of standard functions, like “Search Parameter”, because bounding text may be variable. So, you need to implement more complex search algorithms to find the right value occurrence.

All the above cases are relatively rare and they are specific for each web application. In this topic I will show how to implement with JavaScript another task, which is very general. As you know, WAPT Pro can validate server responses by a keyword. This feature is available on the “Response Processing” tab for any request.

Validation option

However what if you need to validate with help of several keywords? Unfortunately this is not possible with the standard validation functionality, but you can easily implement this in JavaScript.
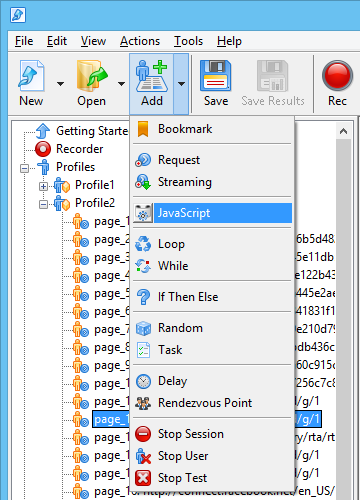
To do this choose “Add | JavaScript” on the toolbar.

JavaScript operator

This will insert a JavaScript operator to the profile next to the currently selected request in the left view. The code will be executed in each user session. It can access the content of the recently received page. That is why it is possible to work with values contained there and perform various validations.

For example, if you want to invalidate page in case it contains any one of the tree keywords (suppose that those keywords appear in case of different errors), you may use the following code.

var pos1 = context.responseBody.search("string 1");
var pos2 = context.responseBody.search("string 2");
var pos2 = context.responseBody.search("string 3");
if ((pos1 >= 0) || (pos2 >= 0) || (pos3 >= 0)) log.error("Validation error");

If you want to invalidate the page in case it does not contain one or more of the three strings of text, you can use the following code.

var pos1 = context.responseBody.search("string 1");
var pos2 = context.responseBody.search("string 2");
var pos2 = context.responseBody.search("string 3");
if ((pos1 < 0) || (pos2 < 0) || (pos3 < 0)) log.error("Validation error");

You can easily modify those examples to work with more complex validations with different number of keywords. All you need is a quick reference on JavaScript.

Note that errors reported this way will appear in the report in the “Other errors” table. As those are not related to specific pages (in general), error rate is not calculated for them, so you will see the total number of error occurrences.

Posted in WAPT usage | Tagged , , , | Leave a comment

What I like the most in WAPT Pro 4.0

We introduced WAPT Pro 4.0 about a month ago. It was a long awaited release that we had been working on for more than two years. The full list of new features is available here as usual. This looks more like a marketing message, of course. If you want to know what I personally think about each feature, I can provide different comments using the same list. This is a kind of exclusive information for the readers of this blog.

1. Adjustable pass/fail criteria.

Good feature for people who need an exact answer to any question. In practice, this feature is useful for automated regression testing. When you start testing a new web application, don’t try setting a criterion in advance. You will need to review the report in any case.

2. Automatic analysis of test results.

Basically this is the same as pass/fail criteria implemented in JavaScript. The difference is that you can run the test one time and then apply as many methods as you want analyzing the results. This is definitely for sophisticated minds. I like that feature, because it lets you find very specific things in a large data volume. At the same time I realize that 99% of our users will hardly need this.

3. Customizable reports.

In fact this means that you can now remove unneeded data from the “Response time” table. Tools like a very small feature, but it really improves the readability of reports.

4. Performance degradation metrics.

You can set “baseline time” time for each request and see the difference after you run the test. I can tell frankly that I do not understand the importance of this feature. Many people speak about “performance degradation factors” and this seems to be popular. That is why we can measure it now.

5. Flexible error handling.

Another small, but very useful feature. Imagine that you need to test a web site that always produces an error on some request. If you just delete that request from the profile, the quality of emulation will suffer. If you disable breaking sessions on errors, you will have total mess in the report. Now you can disable error handling for that specific request and run test as usual.

6. Improved test recorder.

In fact, we have reworked it completely. Remember when you opened a long page in the old version, sometimes you had to wait for a minute before anything appeared in the left view. Now you see all HTTP requests immediately in a raw format. This creates a much better visualization for the recording process and removes any delays. All the recorded content is processed only after you click the “Stop Rec” button. I think that the new recorder is a real usability improvement.

7. 64 bit version of the workplace.

If you do not work with long profiles and reports, you will hardly notice the importance of this feature. As for me, I like it a lot, because I am tired of explaining why it is impossible to work with 5000 requests in a profile. While I still think that you should avoid creating such long profiles, I am happy to state that 64 bit version can work with that without crashing.

8. New GUI and usability features.

Well, we have replaced all the icons, but this is not what I wanted to mention. What is really useful is that you can now open as many WAPT Pro windows as you want. This way you can compare different test results and even work on different projects in parallel.

9. Integration with Jenkins.

It is still a big question if many of our clients use Jenkins… So, I need more time to estimate the importance of this feature. We will see.

Posted in WAPT usage | Tagged , | Leave a comment