We released the latest versions of our load testing tools few months ago. All users who have had an opportunity to update their product installations already know that two major features in that release were the support of HTTP/2 protocol and the ability to execute concurrent requests in each user session. In fact, each of those features is a complement to the other one, because the development of HTTP/2 was inspired by the idea of concurrency in the first place.
Yet, it is true that not every web application has switched to the new version of the protocol by now. So, what if your test project does not require any of these major features? Will you get any benefits after upgrading to WAPT Pro 5.0 from the previous version of the tool? Yes, you definitely will, and I am going to show you why. I will briefly list some new features that I find most useful in the latest version of WAPT. However small each of them may seem by itself, together they make the new version of the product more user-friendly and easier to use, which means faster test creation and more accurate results.
Multiple encoding schemes
Let’s start with the most long-awaited one. As you know, when special characters appear as a part of an URL or inside the parameters of HTTP requests, they must be encoded, i.e. replaced with the “%”-codes. Unfortunately, different servers apply slightly different encoding rules. For example, in some cases the “@” character is encoded, but sometimes it is passed as is.
That was a big problem with all previous WAPT versions, because they applied only most common encoding scheme. Wherever a different rule was used, WAPT treated that as a non-standard encoding and did not decode such values leaving them in the poorly readable encoded form. It could not apply automatic parameterization to such values too.
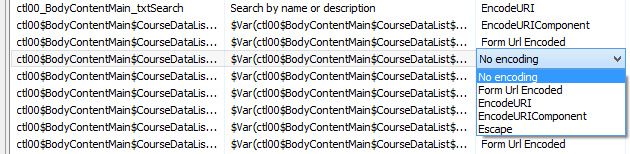
Now you have a choice of encoding schemes for each parameter, and best of all, the right option (or the most relevant one) is selected automatically on recording.
Page resources as sub-requests
What was regarded as “page elements” in the old version is now renamed to “page resources”. They are shown as sub-requests in the left view and each of them has almost all properties of a regular request. This makes them easier to parameterize.
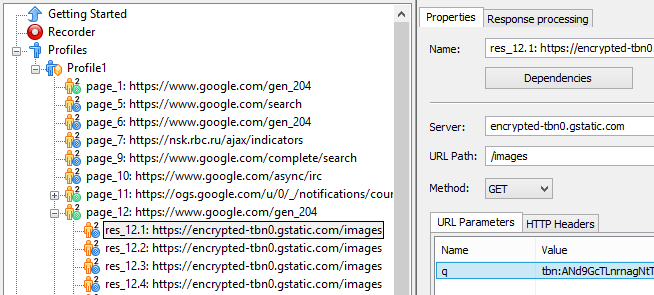
Besides that you can now clearly see which page requests have additional resource requests associated with them and which do not.
Status bar information
If you select a profile or a number of requests inside it, you can now get cumulative information on the selection in the status bar. This way you can assess which part of the profile is lighter or heavier in terms of response size, number of variables or time it takes to execute.

POST requests with green icon
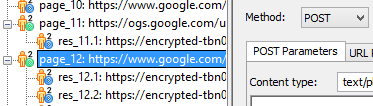
Usually only a small number of requests in a profile use POST method, yet those ones are most important, because they actually post data to the server in order to perform a transaction. Now they are not lost among other numerous routine requests and can be easily spotted by the green icon.
JavaScript test button
The easiest way to insert a JavaScript code in a profile has always been the JavaScript operator. However to check the result of the code execution one would need to verify the whole profile and review the log. That turned the code debugging into a nightmare. With one elegant change we have just fixed that by upgrading the functionality of the “Test” button located next to the code view. Now it does not only perform syntax check, but actually executes the code taking the original server responses and variable values for the context.
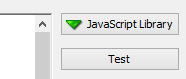
This is now similar to the work of that button in the function specification dialogs.
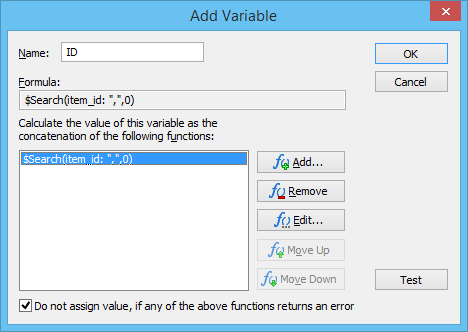
Variable calculation on each redirect
Redirects are processed by WAPT automatically and you very rarely need to intervene in that process. This is only required when you need to get a value that is only available in the intermedium server response. This may be an ID passed as a part of the “location” header identifying the new URL to follow. In the old versions the only choice to handle that was the option not to follow redirects. The use of that option, in turn, required you to add the redirected request manually and parameterize it.
Now you can extract data from intermediate responses the same way you do this with the final one, i.e. with help of functions accessing the response body and headers. This is because all variables defined on the “Response processing” page are now calculated and reassigned on each redirect. In most cases this results in final values being extracted from the latest final response, however if you look for a value that can only be extracted from an earlier response, you can also choose not to reassign it in case the function returns an error.
This will make the latest correctly assigned value final.
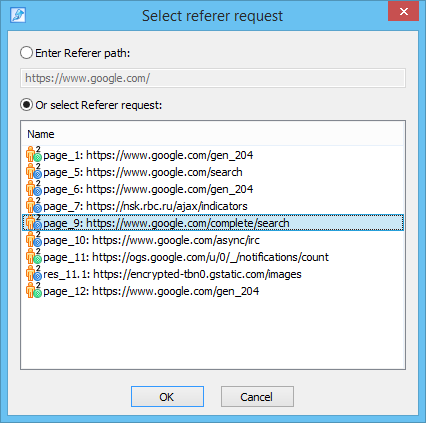
Referrer header specification
The “referer” header is very rarely regarded by the server, meaning that in most cases you can supply any value in it and get correct response. Yet, in some cases you do need that header to be correct and carry exactly the value expected by the server. That is why now that header is not created automatically basing on the URL of the previous request, but stored in the profile and can be redefined manually. When doing that you do not need to use variables for the parameterization. Just select the right request from the list and WAPT will insert session-dependent URL of that request automatically.
Much faster and more informative logs
Even though it is not recommended to enable full logging for large tests, in some cases the ability to do so is crucial. And if you do this for a reason, you expect to have all the means of browsing through the logs and getting all the useful information from them. So, the fact that in the latest version the log viewer works times faster is good news for such scenario.
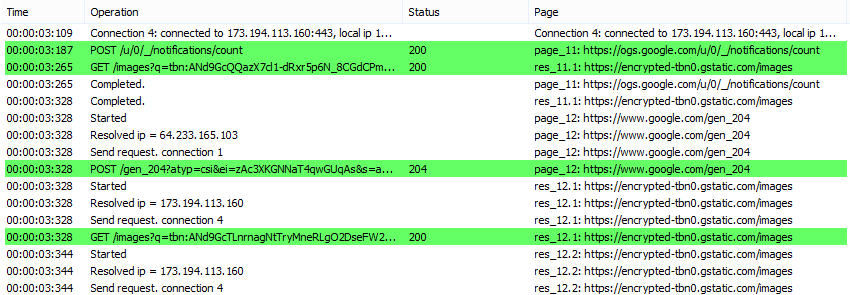
If you only use logging for verification and small tests, you do not need extra efficiency, but you still can benefit from a better structuring of information and additional details, like breakdown to the level of connections, streaming chunks and separate WebSocket messages sent or received.
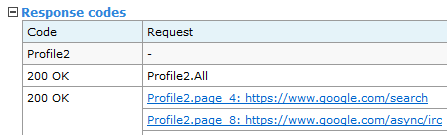
Clickable link to logs from the verification report
Finally, there is a feature that will save few seconds of your time on each test verification. Now in the verification report you can click any request to open it instantly in the log. Simple as that, but imagine how this adds up to hours of work saved over the whole period of test debugging.
* * *
Since the original release we have created a number of updates fixing all the little flaws unavoidable in any newly redeveloped software. So, even if your usual strategy is to stay away from fresh versions for the sake of stability, now it is time for you to update safely enough. Note that if you install the new version on the same system with the old one, they will not conflict with each other. This will let you use both versions for the transition period while you are converting your current test files and getting accustomed with the new features.