WAPT Module for ASP.net testing

All ASP.net web applications use two specific parameters: __VIEWSTATE and __EVENTVALIDATION. When the client part of such application communicates with the server side, every produced HTTP request includes these two parameters:
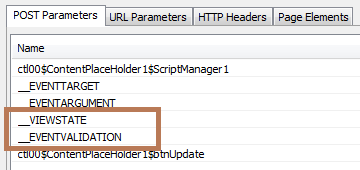
ASP.net specific parameters

The values of the __VIEWSTATE and __EVENTVALIDATION parameters are essentially dynamic. In fact, they are changing for each request within a session. Of course, they are also different for different sessions. This means that you cannot repeat the recorded requests “as is” to produce a copy of the recorded session.

Initially the values are produced by the server part of the application and transferred to the client inside the body of each response. After receiving the updated values the client should include them as parameters in the next request. In response to that request it will receive new values that should be used in the next request, and so on.

Why is this needed? Obviously this question should be better addressed to the creators of ASP.net, but I will try to provide my version. Overall the situation is very similar to how web applications use session IDs. They are usually handled by cookies. I wrote about that here.

The difference is that in general it is possible to work with several different “viewstates” within the same session. The client can revert to an older value of that parameter and the server will know that the current request should be applied to the corresponding older context.

Anyway, what is important for us is that every server response contains new __VIEWSTATE and __EVENTVALIDATION values. To reproduce user sessions correctly, WAPT should extract those values to variables and pass as parameters inside the next request.

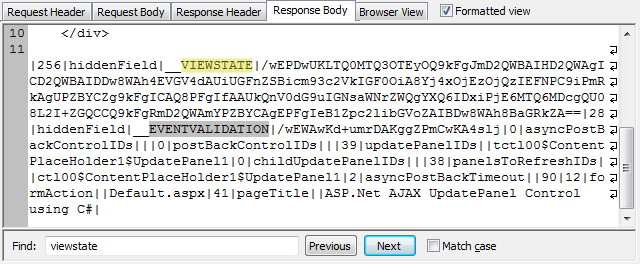
Let’s see how these values appear inside server responses. There are two different notations used for this. They are shown on the following images.
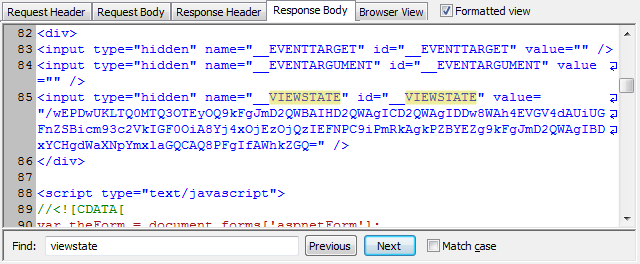
Hidden control notation

Update Panel notation

In the first case the values are passed inside the hidden controls of HTML forms. When WAPT meets such values, it parameterizes them automatically. It creates variables for all hidden form values, including ones we need. This is described in more details here.
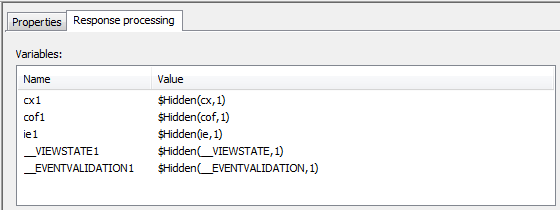
Variables for hidden controls

It also uses the values of the created variables in the next request. As a result, everything works fine and the whole thing is done automatically.

However what happens in the second case? Unfortunately the values remain not parameterized, as we see on the following screenshot.

Not parameterized values

What will happen if we verify or run a test with such profile? In most cases the web site will not produce an error. It will receive the old __VIEWSTATE value and will treat the request as one belonging to the originally recorded session. This will be obviously incorrect, but the exact outcome depends on your web application. Possibly you will not see any errors on the test verification, however if you check the returned response, it may include incorrect data.

For example, imagine that when you originally recorded the session, your application accessed a specific database record. When you execute your test with 100 virtual users, you want each of them to pick a different record and perform the same operations with it. You can parameterize the record number (or other higher level options used to pick it) and this will work fine for the request that initially selects the record. However as soon as the session comes to the request with the not parameterized __VIEWSTATE value, that request will apply its actions to the database record selected in the initially recorded session, not the right one.

That looks quite bad. So, what to do? The answer is very simple: you should parameterize all occurrences of the mentioned values for all requests in your profile. You should specify how to extract the values from server responses to variables. Then you should insert these variables to the list of parameters instead of the initially recorded values.

Of course, this may require some time to go through all the requests. Fortunately there is a much faster way to do this. It is provided by a special extension module for WAPT. It is installed and licensed separately from the main product. You can download it here.

After you install the module, WAPT will handle the responses containing the __VIEWSTATE and __EVENTVALIDATION values differently. It will use additional functions implemented in the module to extract those values in all cases. Now the response processing tab will look like this:
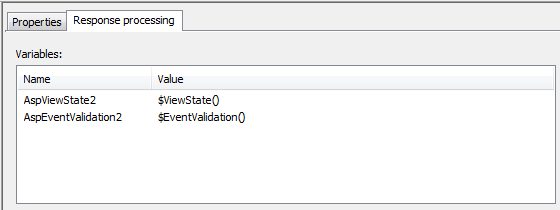
New response processing

The parameters containing our values will be made dynamic automatically with help of the corresponding variables:

New parameter assignment

Conclusion. Our customers often ask me if they need to purchase the Module for ASP.net testing in order to test web sites implemented in ASP.net. The answer is: if your web application always passes the mentioned above values only inside hidden form controls, you do not need the module. Otherwise you can either make parameterization manually, or use the module.

The reason why we recommend using the module is that otherwise you will need to check thoroughly all the requests in your profiles. As I noted above, if the ASP.net values remain not parameterized, this does not usually lead to HTTP errors easily visible in the log. However this can make the user emulation incorrect and essentially reduce the reliability of your test.

P.S. All screenshot in this post were made using a profile recorded at the following ASP.net demo resource: http://www.ezineasp.net/Samples/ASP-Net-AJAX-cs/Extensions/AJAX-UpdatePanel/Default.aspx

You can try recording with and without the module to see the difference.
Posted in WAPT usage | Tagged , , , , | Leave a comment

Efficiency and capacity of load testing tools

If you are looking for a load testing solution to check the performance of your web site, or to start using permanently in your web development process, you may need to analyze various characteristics of many tools before you make your choice. One of such characteristics is the efficiency.

If you want to test a web application used internally by your company staff, you may need to check that it supports, say, 100 concurrent user sessions. This is not a very big load for any tool. You will hardly need more than one generating system to run such test.

The situation is completely different, if you need to stress test a popular internet portal. A load of 100,000 concurrent users can be a good check for it.

In both cases you may have typical user sessions of similar complexity, so it will take same time to design the tests. However they are very different in capacity. That is why for the second case you need to pay very close attention to the ability of your testing tool and hardware to generate a big load volume.

Note that many vendors charge for their tools depending on the number of virtual users. Others have different versions of their products with different capabilities. In any case, if you plan to create a big load, you should choose an extendable solution: your load testing tool should be able to use several systems for load generation.

At the same time you should check (or ask vendor about) the efficiency of each load generating unit. In other words, you should plan how many virtual users can be produced by a single system in your testing environment. Surprisingly, this number ranges from 200 to 10,000 (and even more) for different solutions.

The main reason of such significant difference is that “slow” tools use browser component to run each virtual user. This consumes almost as much system resources as launching a real browser to run each user session. Imagine a computer with 200 open Internet Explorer windows and someone clicking new links in each window every 5-10 seconds. Will it have resources for more users to run?

In fact, such approach is good for functional testing, because it provides a better control over each user session. You can see it step by step in the browser window and easily understand (or check automatically) if something goes wrong. Some testing tools initially targeted on functional testing have been extended by their vendors with the load testing functionality. As a result, they can now run many concurrent sessions, but do this relatively slow.

The “fast” tools record and execute user sessions as sequences of HTTP requests. Of course, these sequences can be dynamically modified for each instance, so different virtual users can send user-specific data to the server. However the main approach is that each user session is a sequence of HTTP requests. Such tools do not need any browser to run the test. They perform all the emulation themselves. Instead of spending significant system resources on rendering HTML and running JavaScript code on the received pages, they provide possibility to find and extract significant data from server responses and use it in subsequent requests.

Of course, if you need to create a really high load, a tool that uses “fast” approach is much preferable.
Another thing that should be noted regarding the efficiency is that it can be measured in different ways. Usually people talk about the number of concurrent virtual users that can be generated by a testing tool. However such estimation does not take into account the behavior of these users. The most obvious question that should be asked is: how often each emulated user will send requests to the tested web site?

A human user does not click links every second. People need some time to perceive the content of a page in order to understand what to do next. Virtual users simulated by load testing tools also make pauses between successive actions. This is done just to make them more similar to real users. However, if you reduce all these pauses, say, 10 times, same user session will be executed much faster (not 10 times faster, because some delays also take place because of the server response time, which will remain the same). Obviously, if you check how many such “fast” concurrent virtual users can be created using the same testing environment, you will see that the number will be much smaller than before.

The above example shows that talking about the number of virtual users only is not always correct. This concerns both the efficiency of a load testing tool and the specification of the test load for the target web site. You should also take into account the “weight” of each user, which (in first approximation) is determined by the number of requests produced per second.

Actually, this is not the only “weight” parameter, because we should remember that different requests require significantly different system resources to produce (on the client system) and to serve (on the target web site). When user submits a form or requests some information from a database, the corresponding HTTP request requires much more server resources than a request to a static image or text.

The client also spends resources on processing the web site responses. This is often required to extract important session-specific values that will be reused in subsequent requests. Searching for a keyword inside a 100 kb HTML page will not take significant CPU time, if this is done once. But what if we need to search for 10 different keywords and do this for each of 10,000 concurrent users?

So, when you check the efficiency of a load testing tool, you should test how fast it can process long server responses.

The above observations suggest one useful trick that can help you evaluate a load testing tool. Usually demo versions are restricted to some limited number of virtual users. This is normal, because vendors do not want to let you perform the real tests with the demo. At the same time such limitation does not prevent you from evaluating all the product features.

At first glance this does not let you check the efficiency of the tool. However there is a way to do this. Just remove from your test all the delays between requests. As a result your virtual users will start working very fast. Even if you are limited to 10 or 20 virtual users, you will be able to create load that is normally created by hundreds, if not thousands. Now check how many requests the tool is able to produce by second. This will be good efficiency estimation. Of course, you should perform such tests on a very fast web site, because otherwise server side delays will spoil the whole plan.

By the way, you can apply same trick to overcome the license limitation of your tool. As I mentioned above, some vendors charge for load testing solutions or services depending on the number of virtual users in your test. However if you need to test a web site with 2000 virtual users, but your license only allows you to run 1000, you can simply reduce all pauses between requests in your test and run it with allowed 1000 users. The resulting load will be approximately the same as the load with 2000 normal users with the initially set delays.

I would not say that the above practice is highly recommended, because such approximation does not take into account many other things. For example, it may appear that the web site can serve 1000 concurrent connections very well even on high speed, but gets broken on 2000 connections even with very slow users. So, if you want to get 100% correct results, you should make your virtual users as much close to the real ones as possible and create the required number of them. However as a “rough” test the above scenario will work.

The ability to change the user speed and its influence on the resulting load is something you should know about. As any other good trick, it should be applies reasonably.

Posted in General | Tagged , , , , , | 4 Comments

Load testing a mobile website for iPhone

While mobile devices are replacing PCs for almost all possible applications, the Internet is also changing to address this technology shift. On the other hand, despite the unbelievable progress in the performance characteristics of smartphones and handheld computers, they are doomed to stay different from PCs by one parameter: screen size. That is why most web sites offer different content when they are visited from a mobile device.

Of course, this content is usually just a reduced version with a very similar functionality. However the implementation of the underlying web application can be different. As a result, your web site can experience significantly different performance problems when it is accessed by multiple mobile users. So, if you want to perform load testing of your web site with a realistic emulation of real users, you have to include mobile users to the scenario as a separate category.

In general, the web site checks the “User-Agent” HTTP header to determine the client browser and system. For an Internet Explorer version that header can look like this:

Mozilla/4.0 (compatible; MSIE 7.0; Windows NT 6.1; Trident/5.0; SLCC2; .NET CLR 2.0.50727; .NET CLR 3.5.30729; .NET CLR 3.0.30729; Media Center PC 6.0; InfoPath.3; FDM; .NET4.0C; .NET4.0E)

Here is an example for iPhone:

Mozilla/5.0 (iPhone; U; CPU like Mac OS X; en) AppleWebKit/420+ (KHTML, like Gecko) Version/3.0 Mobile/1A543a Safari/419.3

Actually the long list of parameters can be different. It is used to check for additional options, if they are required. However the main OS/browser specification is sufficient to distinguish between PC and mobile device. That is what the web site does when it receives the very first request from a user. Then it provides corresponding page content in reply.

So, a very simple solution would be to replace that header for some sessions in the test. However this is not an accurate approach, because in fact the whole session can be different for a mobile user. So, in fact, the only real solution is to record the whole session using a mobile device.

The latest version of WAPT can record and replay user sessions from external browsers. It can even record sessions from browsers running on different computers. The only requirement is that it should be possible to connect from your browser to the system where you run WAPT. Let’s see how this can be done with an iPhone device.

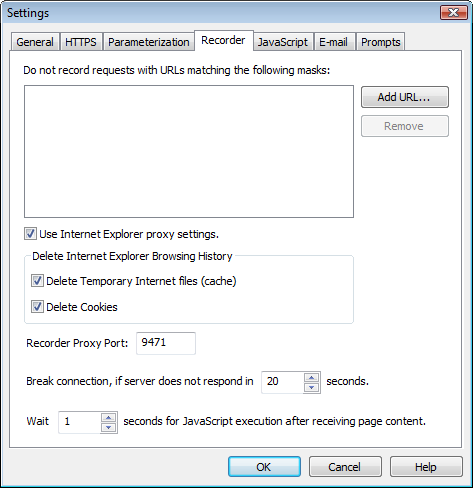
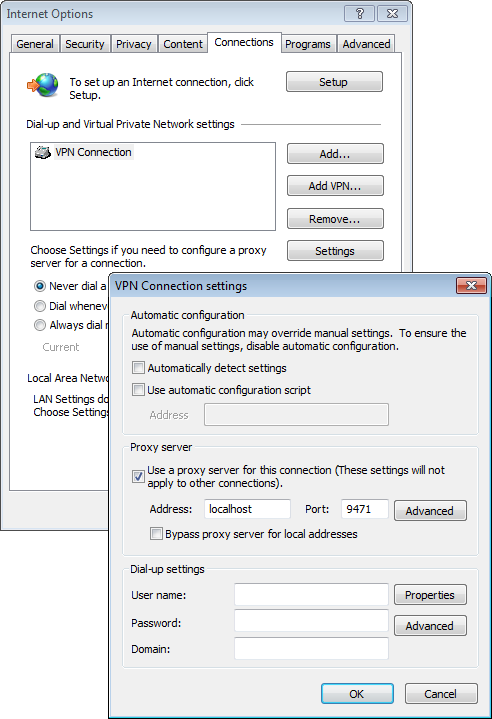
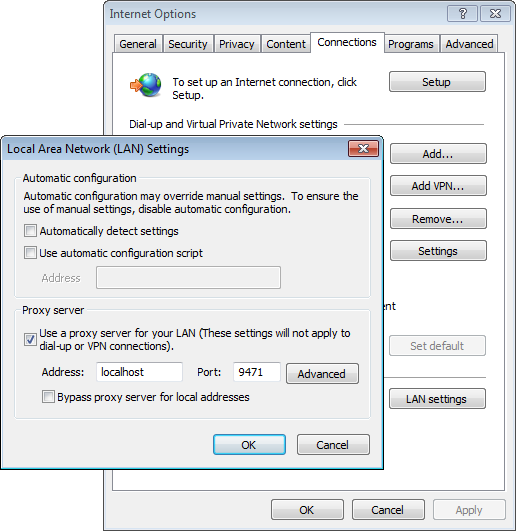
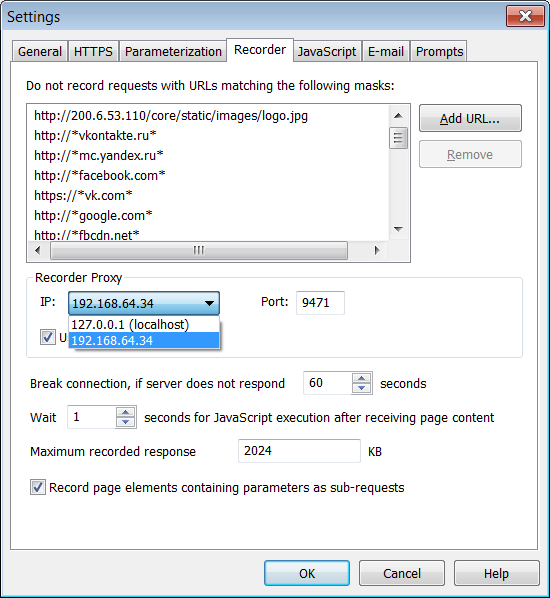
When recording test sessions, WAPT is acting as an HTTP proxy between your browser and the target web site. This lets it intercept all the traffic and replay copies of the recorded session during the test. First of all we need to change the IP address that WAPT uses as a proxy. By default it is set to 127.0.0.1 (localhost). We need to change it to an address that will be visible for other systems. In general there can be many addresses available on a system, but if it is connected to a network, it should have at least one in addition to localhost.

We can change this in WAPT settings on the “Recorder” tab.

Recorder settings

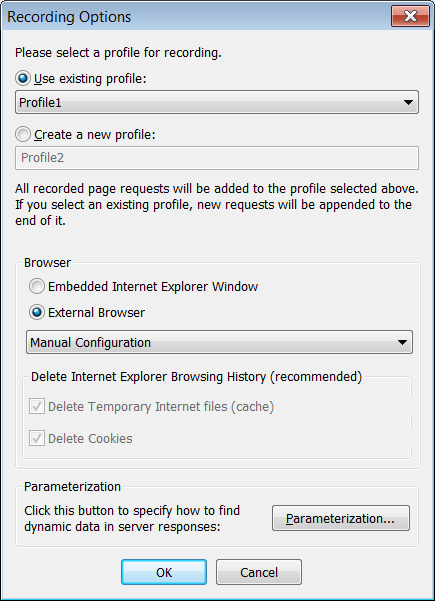
Now let’s start recording by clicking the Rec button on the toolbar. In the “Recording options” dialog we should select “External Browser” option and choose “Manual configuration” in the list of available browsers.

Recording options

After we click “Ok” WAPT displays a page with a short instruction that we should follow.

WAPT screen

Now let’s get to our iPhone. We assume that it is already connected to the same local network via Wi-Fi. In general it can be connected to the Internet by any means, but we want to use WAPT as an HTTP proxy, so our iPhone should be able to connect to the system where we run WAPT. In other words, the IP address that we selected in WAPT should be visible from the iPhone.
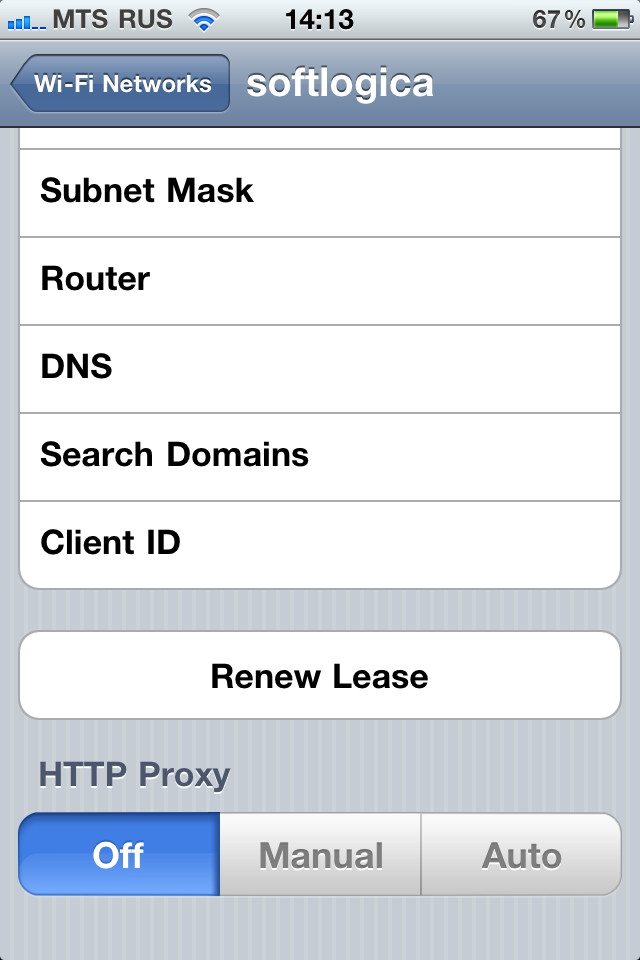
So, we go to the connection properties on the device…

iPhone connection settings

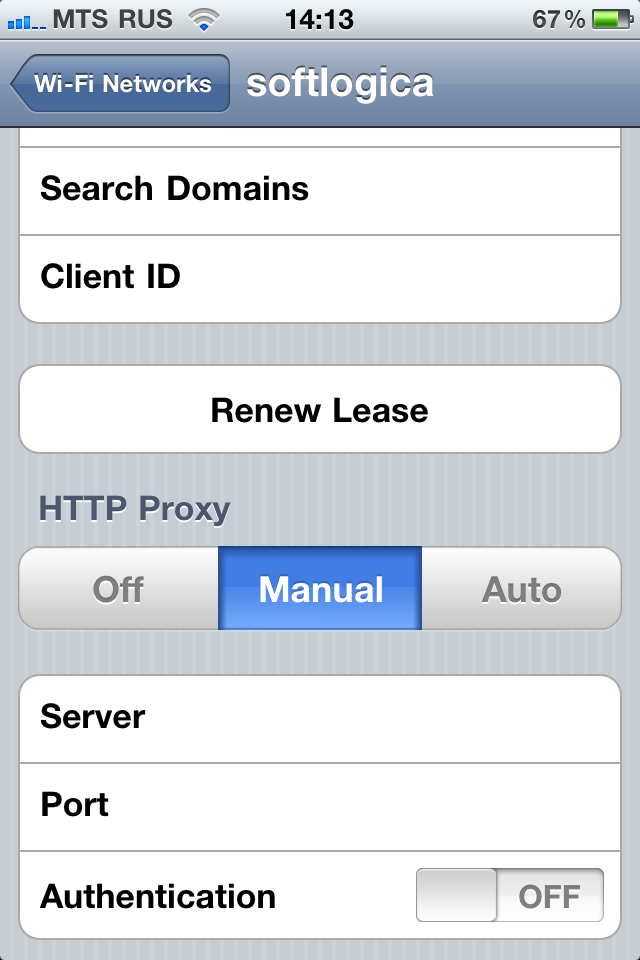
… and choose “Manual” configuration:

Configuring iPhone

Here we enter the IP and port number selected in WAPT.

Server and port

Now we can start browsing our web site from the iPhone. Our session will go through WAPT (because we set it as an HTTP proxy) and it will record all our requests same way as if we were recording using the embedded browser window in WAPT.

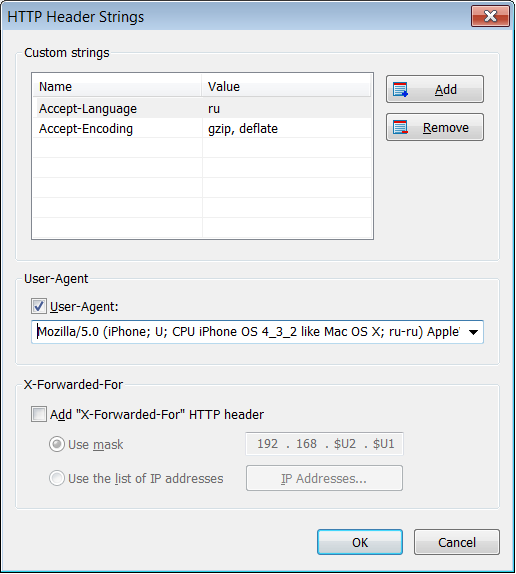
To make sure that the above theory is correct, we can now open the profile properties in WAPT and click the “Default HTTP headers” button. We see the default headers recorded for our session.

Recorded headers

The last thing that we should not forget to do is to change back the proxy settings on the iPhone. Otherwise it will always try accessing the web only through WAPT and will fail after we stop the recording.

Posted in Testing practice, WAPT usage | Tagged , , , , , | 3 Comments

Stress testing a web site with 100,000+ virtual users

It is not a typical load testing project when you need to create 100 thousand virtual users. More than half of all web load tests are conducted with just a thousand virtual users or less, because higher load is not actually anticipated on the target web site in production. Note that we are not talking about the number of users per day or hour. Those are concurrent users working with the web site simultaneously, in parallel.

At the same time a huge load mentioned in the title of this article is not a fantasy. Such tests are really required for web sites with growing audience and advanced client functionality. Imagine any web site that delivers customizable user-dependent content updating dynamically: stock quotes, online meetings and chats, monitoring tools, etc. When a user of such web application leaves an open browser page, it keeps refreshing every minute sending a repeating request to the web site. In such case a typical user session may last for hours resulting in a rather big number of concurrent sessions at any time moment.

Not every load testing tool can emulate such load. I am happy to say that now we can offer a product that does this really efficiently. We released it several days ago as a new load generating component for WAPT Pro. Its name speaks for itself: x64 Load Engine.

This new powerful extension can replace the previously used load agents for high capacity tests. It dramatically increases the estimated number of concurrent user sessions that can be produced per one system used in load generation. According to our tests, the average capacity is increased at least 5 times and the load of 10,000 virtual users is easily achieved using a single middle-level 64-bit server.

This number can be even bigger depending on the hardware configuration and the test options (such as virtual user profile length, the complexity of server response processing, the rate of requests within a session, etc.). On a high-end hardware the produced load can grow up to 35,000 users per system. This means that using only 3 producing servers it is possible to load test a web site with 100,000+ concurrent virtual users.

The x64 Load Engine can be installed on any system with 64 bit Windows OS starting from Windows XP. The product is available as a separate extension and not included in the standard WAPT Pro installation package, which continues to provide standard load agents suitable for lower capacity tests.

At the same time the transition from load agents to x64 Load Engines is very simple, because the engines can be managed from the WAPT Pro workplace component same way as agents. They provide much higher performance while presuming all the ease of use.

In fact, the functionality of the x64 Load Engine is identical to the functionality of the regular load agent. The only difference is the much higher performance achieved because of its native 64 bit architecture. You can setup the engines on several systems and use them concurrently to create greater test volume. The workplace component of WAPT Pro manages the work of the engines same way it does it with the load agents. Both agents and engines appear in the same list, where you can edit their properties and select the ones you want to use in the test. You can also search the local network for the available agents/engines and add any remote ones manually by their IP and port number.

So, should you need to run a really big stress test, we are happy to recommend WAPT Pro and x64 Load Engine at your service!

Posted in Testing practice, WAPT usage | Tagged , , , , | 4 Comments

WAPT Pro 2.5 is finally released!

We have been working on this release for quite a while and now I am happy to announce the release of WAPT Pro 2.5. The product is available for download here. As usual, all registered users of WAPT Pro can upgrade free of charge.

We will also update the regular version of WAPT soon. It will include same features except the last two in the list below: we provide them only for the experts who use the Pro version. So, here is the list of new features.

Recording tests with Firefox, Chrome, or any other external browserRoblox HackBigo Live Beans HackYUGIOH DUEL LINKS HACKPokemon Duel HackRoblox HackPixel Gun 3d HackGrowtopia HackClash Royale Hackmy cafe recipes stories hackMobile Legends HackMobile Strike Hack

WAPT is now integrated with the most popular browsers: Internet Explorer, Firefox and Chrome. You can use any of them to record user sessions for your test. You can also use any other external browser running on the same or different system as well as on a mobile device.

Ability to identify the source of dynamic values in server responses

While working on the test parameterization, you need to determine the origin of each dynamic value appearing inside the user session. Now WAPT can automatically search server responses and suggest a place from which the value can be extracted.

Full recording and replaying of request headers

WAPT now records all HTTP headers and uses them when executing the test. It automatically handles changing data contained in dynamic headers, such as cookies, and let you specify custom header values. This can be done either for the whole virtual user profile or for each request separately.

Support for request parameters passed without values

Some web sites require certain request parameters to be passed without a value. To support this situation WAPT now has an option to mark any parameter as having no value.

A new operator for stopping the test execution on an exceptional condition

In addition to the “Stop session” operator, you can now use the “Stop test” operator that interrupts the entire test execution.

New options to handle page elements recording

You can specify how WAPT should distinguish between general page requests and requests to page elements, such as image files. Usually page elements do not require parameterization and it is preferable to keep them in a separate list in order to optimize the test.

Easy conversion of page elements to separate requests and vice versa

If a request was recorded as a page element, but you need to parameterize it, you can easily convert it to a separate page request. In the opposite situation you may need to convert a bunch of sub-requests to page elements of a parent request. Both changes can be done with couple clicks.

Emulation of browsers with disabled cookies

Some people use security options that disable cookies in their browsers. As a result, web applications have to use different methods to pass session variables to the server. To include such sessions in your test you can disable cookies support in WAPT for the corresponding profiles.

Ability to export full test execution data to an external base

You can use any external data management and processing system to work with the results of your load tests. WAPT Pro can export the complete test statistics, including timing for each separate request and response.

New calculation modes for database performance counters

For some database performance counters (such as the total number of performed transactions) it is preferable to measure the rate at which they are changing, rather than their instant values. Now you can specify for each custom counter how its value should be monitored.

Posted in WAPT usage | Tagged , , , , , | 1 Comment

Creating a load test report

One of the most common questions in load testing is how to create a good test report that you would be able to present to your manager or customer. This big question actually consists of many smaller ones. What to start with? How to create the right test? What load parameters should be applied? How to interpret the results? Which numbers to look at when you browse through a long report generated by a load testing tool?

I will hardly answer all these questions and present the complete methodology in one article. This would be a long story and… it would be too boring. I know that there is a 90% chance that you really need something more simple and ready to use right away. I will simply present an example of the load testing report. A typical one, if you want.

However first of all I have to mention several steps you need to do in order to obtain the test data that you will use to create the report.

  1. Define test goals. The main difference between functional and load testing is that a load test cannot pass or fail until you specify additional conditions. You cannot test that a web site can stand load in general, but you can test that it can stand some specific load with some specific performance parameters. These requirements should be determined by the business goals.
  2. Describe test goals in technical terms. As soon as you have an understanding of what exactly you want to check in your test, you need to formalize these requirements and transform them to technical terms that can be applied in you load testing tool. You need to define the type of load, how many virtual users will run on each test phase, what is the acceptable response time, etc.
  3. Create a realistic emulation of virtual users. This is probably the most complex and important task. First, you need to divide all potential real users of your web application into different types depending on their expected behavior on the site. Second, you need to create a special script, (profile, scenario, or whatever term is used in your load testing tool for this purpose) for each type of users separately. Finally, you should make sure that they work correctly and produce consistent user sessions.
  4. Run the test. This is probably the easiest task. The only important thing to remember is that if you apply a significant load volume, you should make sure that the resources of the systems that you use for load generation are sufficient, and your load testing tool does not get overloaded itself. The same can be said about you network capability that can also limit the load volume, if you transfer significant amount of data in your test.
  5. Analyze test results. How to get valuable information from a series of digits reported by your load testing tool? This is not as hard as it seems to be. First of all you should check that the test went as expected, the load specified for each phase was really created, and there were no errors occurring because of an incorrect work of the load testing tool or your test scripts. After that it’s time to check if the tested web site worked as expected under the load: number of errors, response times, and number of sessions/requests served by second. You should check how these parameters change depending on the load volume.
  6. Isolate problems and suggest improvements. The web site can consist of several components, such as load balancer, web server, application server, database, etc. The performance of the whole system is usually limited by one of these components. This means that improving or fixing that component can result in significant growth of performance, while improving other components will not change anything. Such component is also called “performance bottleneck”. Note that this does not necessarily mean that you should completely change the hardware or reinstall something. In many cases improvement can be achieved by changing options, or fixing bugs in the application code.

Now I am ready to show what I promised from the very beginning: an example of the load testing report. Please note that it is not a general template that can be used for all cases. It is rather a simple, but most common example. Here it is.

1. Test objectives

We need to find out if the web site meets the performance requirements as specified below.

The site needs to be able to handle 20000 unique visitors per day providing the industry standard level of service in terms of response time and error rate. Average response time should be less than 5 seconds and error rate should be less than 1%.

We also expect that average number of simultaneous users on site will be about 150, during the peak hours it will grow to 300. We need to check that the site can handle this load.

2. General test conditions

The following test conditions are most appropriate to simulate the real life site usage.

  • Number of page requests per user session: from 15 to 20;
  • Average user time on site: 10 minutes;
  • User actions:

a)      browse site content, perform search (80% of all users);
b)      purchase items (20% of all users).

3. Tests performed

The following two tests have been designed and executed.

3.1 Capacity test

Test duration: 1 hour;
Load type: ramp-up from 10 to 300 users with step 30, every 5 minutes.

3.2 Stress test

Test duration: 10 min;
Load type: ramp-up from 0 to 1000 users with step 2 every 1 second.

4. Test results

4.1 Capacity test

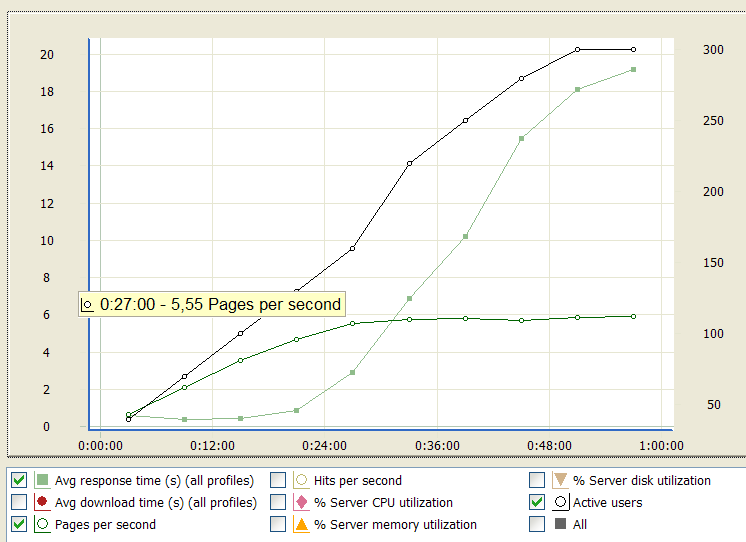
The performed capacity test has shown that the site preserves the desired quality of service only with a limited load. When the number of users simultaneously working with the site goes beyond 160, average response time starts to grow proportionally. When the number of users is about 300, the average response time increases to 19 seconds. See the graph below.

Capacity chart

Number of active users
Active users table

Maximum server productivity in terms of pages per second: 5,5 (see table below).

Pages per second
Pages per second table

Maximum server productivity in terms of hits per second: 115 (see table below).

Hits per second
Hits per second table

Server utilization %
Server utilization table

4.2 Stress test

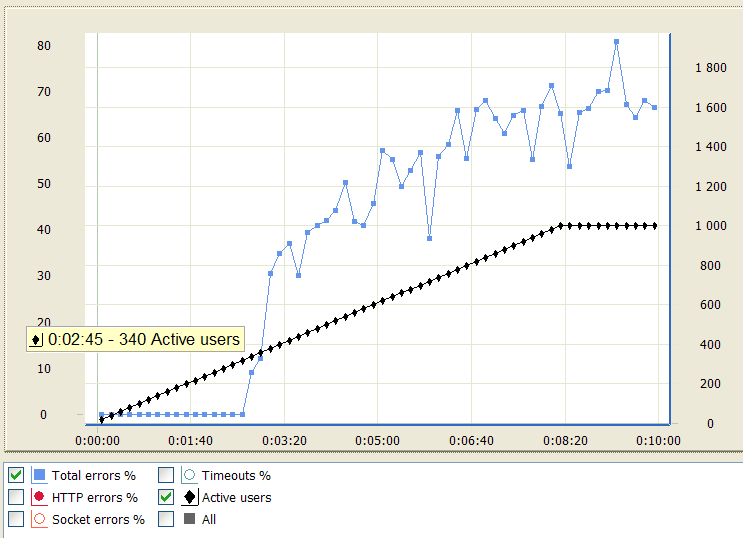
The performed stress test has shown that when the number of users reaches 340, the server starts producing errors. The error rates increases with further load growth. See the graph and tables below.

Stress test graph

Number of active users
Active users table

Total errors %
Errors table

5. Conclusion

The web site can experience slowdowns showing inacceptable response time in peak hours. When the load is at an average or below average level, the desired level of service is provided.

The web server resource utilization measured during the testing shows that the performance problems cannot be related to the web server hardware. We recommend to check if the database server resources are sufficient and/or increase the number of connections with the database.

Posted in Testing practice | Tagged , , , , | 69 Comments

Ten names for load testing

Load testing is a wide and established area of IT knowledge and software development practices. There are many professionals who specialize here and testing gurus ready to provide useful advices and even teach you a theory on the subject. Surprisingly, the mentioned gurus often do not agree with each other on the very basic terms used in this field.

If you search for information on load testing, most probably you will also find articles mentioning such terms as “performance testing” and “stress testing”. Are they all just synonyms? Everybody agrees that they are not, but still different sources provide different definitions for these terms.

The most confusing point is the difference between performance and load testing. Some people reasonably say that since the performance of an application can be measured without creating any load on it, the load testing is a subset of performance testing. Other variants of performance testing may include measuring various parameters that do not depend on the load at all, such as time required to render a web page in the browser, or to perform any other action on the client side.

When talking about stress testing, all agree that this is a type of testing when the server is stressed with a load above normal, and sometimes even beyond peak estimation for the tested application. However for what purpose is this done? Some say that this is just a way to check how the server responds to the rapidly growing load.

In my own opinion such mess in terms is produced by marketing efforts of companies selling testing tools. They want to satisfy expectations of every potential customer coming to their web site. That is why they are providing similar descriptions for all three types of testing mentioned above. In other words, they do not want to lose customers who understand these terms differently. This would be really a dramatic loss taking in account that all the same tools are used for all types of load testing.

Since I am not concentrated on selling anything to any particular customer right now, I have a freedom of developing a theory that would serve better understanding of the subject. So, no matter if any guru likes my classification, here it is.

Load testing. I prefer to think of load testing as of a blanket term for all other types of testing that are done under the emulated load. Basically each of them can be described and distinguishing from other ones by specifying the following test options.

  • The main goal of test execution.
  • The type and volume of applied load (it may be changing throughout the test).
  • What parameters are measured and monitored when the test is performed.
  • Additional actions performed with the tested system during the test.

Performance testingPerformance testing. Here I consider the performance testing only as a type of load testing. I understand that it can have a wider meaning, but I want to mention only the performance testing done under the load.

In this type of test we gradually increase the load by adding more and more virtual users to the test and check the performance parameters of the system at each test phase.

The main things we monitor are:

  • Web site response time;
  • Number of processed requests per second;
  • Error rate.

As a result we have a graph showing performance parameters for each load level. So we can tell, for example, what response time we can expect under the estimated load. Since we also have the information on how it is changing throughout the test, we can also predict if this parameter can be improved by upgrading hardware and if it is stable.

Capacity testingCapacity testing. This type of test replies to the most common question in load testing: how many concurrent users the web site can handle while maintaining good response time and error rate.

Again, we add virtual users gradually, but in this case we know the performance criteria in advance and just need to check that they are observed. When the performance starts to degrade significantly or just goes below our quality standard, we make the conclusion that the capacity limit is reached.

Stress testingStress testing. Every system has a capacity limit. When the load goes beyond it, the web site can start responding very slowly and even produce errors.

The purposes of stress testing are:

  • Find that limit (in this respect it is similar to the capacity test);
  • Check that when it is reached, the web site handle the stress correctly: produces graceful overload notifications and does not crash;
  • When the load is reduced back to regular level, the web site returns to the normal operation retaining the performance parameters.

In my opinion it is very important to mention last two goals, because they show the specificity of stress testing.

Baseline testingBaseline testing. It is funny to write about that type of testing, but many people do this, so to make the list complete I have to mention it too. By baseline testing people understand some testing that is performed to establish standards for future tests.

This is a bit strange, because I would recommend establishing such standards basing on your business requirements. Nevertheless I can imagine one case when such testing is really applicable. If you already have a live web site and you know that it is working more or less acceptable (you can have a good perception of it by checking cash in your pockets), you may perform baseline testing of that system to convert that perception to a more exact parameters, such as response time. After that you will be able to compare the performance of any new version of your web site with the initial data.

Endurance testingEndurance testing. This type of testing (also called “soak testing”) is used to check that the system can stand the load for a long time or a large number of transactions. It usually reveals various types of resource allocation problems. If a small memory leak is present in the system, it is not evident on a quick test, but will influence the performance after a long time.

For endurance testing it is recommended to use changing periodic load to provoke resource reallocation. When the test is over we should compare resource usage and performance parameters on the early stages and at the end of test.

Volume testingVolume testing. If your application can upload files, upload the largest ones. If it does the search, try to generate long results. Try to maximize the amount of processed data and the complexity of each transaction. This will be a volume testing.

Note that in terms of the number of virtual users the load may remain on a regular estimated level throughout the test. We should already know the expected performance parameters for such load, so our goal is to check that they are not affected significantly by the above mentioned changes in the test data.

Spike testingSpike testing. This is a test in which the load is increased and decreased very rapidly producing spikes. The goal is to check how the server responds to a very fast and significant load change. Depending on the web site implementation it may be reasonable to check this situation separately from other similar cases.

For example, imagine a scalable system that can allocate additional resources when the load is increased. While it can work perfectly with the high target volume, it may experience performance problems during resource allocation or just fail to do this correctly under such extreme load change.

Configuration testingConfiguration testing. The goal of this type of testing is to find out how a change in software or hardware configuration affects the performance parameters under load. If your system consists of several components, you can try replacing some of them and see if the overall performance is changed. This way you can eliminate bottlenecks in your system and find optimal configuration.

Failover testingFailover testing. This is a very interesting type of testing. It is performed under normal anticipated load for which we should already know the established performance parameters. After the initial “warm-up” phase we introduce an unexpected problem into the system. For example, it can be a connection problem between system components, which is easy to emulate by simply unplugging the network cable. We can also suddenly restart or disable redundant components without restarting the whole system.

In this test we monitor two things.

  • How the performance parameters are affected by the introduced failure.
  • What happens when the system comes back to normal conditions.

While it may be acceptable for the overall system performance to degrade temporary for a certain amount of time necessary to fix the failure, it is imperative that it is fully recovered after eliminating the problem. This is similar to the stress testing, but in this case the stress is produced not by the excessive load, but by a temporary problem inside the tested system.

Well, this is the end of my list. One more thing that is worth mentioning is that the load testing in general is not completely separate and different from other testing practices. Some think that it is only reasonable to test how an application behaves under load at the very end of the development process just before it goes in production. This is not so. Of course, any load tests should be applied only after functional testing; otherwise the results will not be correct and useful. However you can integrate various types of load tests into your regular development process and use them as part of regression testing performed on each new build or version of your web application.

Posted in General | Tagged , , , , | 9 Comments

HTTP Redirects

Each HTTP response produced by a web site contains status code. Browser uses that code to interpret the meaning of the response. Basically there can be three different cases:

  1. The request has been processed successfully by the server and the response body contains the requested resource (web page, image, etc.).
  2. An error has occurred.
  3. Server redirects the request to a new URL.

In the latter case the response contains a special “Location” header in which the new URL is provided. When browser receives such response, it automatically issues a new request using the specified URL. This way it can be redirected even to a different web site. The whole thing is done automatically, so the user does not see the process in the browser window. When the response to the new request is received, it is displayed by the browser as if it was the original one. Only the URL in the address bar is changed.

In fact, there can appear several redirects in a row. I mean that the second response can return with the redirect status code again, and so on. However this should end somewhere and usually no more than two redirects are performed.

The status code for redirect is any 3 digit value beginning with “3”, like 301, 302, 303, and so on. It is also usually appended with a status message like “Found” or “Moved Permanently”, however the basic browser action is the same in all cases: it issues a new request with the provided URL.

Why is this needed? There can be several reasons for this. The simplest situation is when the requested resource has really changed its location and now it is available on a different server or at a different address. However, much more frequently redirects are used for the integration between web sites. Let’s see how this is done in practice. The following web page contains a form used to submit messages to the WAPT support: http://www.loadtestingtool.com/support.shtml.

Web form

When I fill the above form and click the “Submit” button, it generates the following POST request to the www.backupboutique.com web site:

POST /cgi-bin/send.cgi?to=support@loadtestingtool.com HTTP/1.1

The following parameters are passed inside its body:

get=http://loadtestingtool.com/support.shtml
from=test@test.com
feedback=test+message

The response of that web site is:

HTTP/1.1 302 Found
Location: http://loadtestingtool.com/support.shtml

This means that it has accepted the information passed to it and redirects the browser back to the same web page that issued the request.

What useful facts about redirects can be noted in relation to load testing? First of all, most load testing tools process redirects automatically. This means that when they record tests, they save only the initial request. They do not add to the test the URL to which it was redirected. When the request is replayed, the server returns a new URL and the testing tool issues a new request to that URL automatically. However it is important to understand that actually several requests are performed and several web sites could be involved in the processing of them.

In WAPT you can see the full sequence of redirects for each recorded request. As noted above, in the test only the initial request is used, but for your reference it is possible to view the details of each recorded redirect on the “Response processing” tab. There is a list box in which you can select the exact request and see its details below.

List box with redirects

By default WAPT shows the last request in the sequence, which leads to some confusion, if you expect to see the details of the original request here. However such behavior is convenient in a more common situation when you want to take a look at the server response. Note that when you add variables to the response processing and use functions to assign values to them, they always work with the latest response in the redirect sequence, because it contains the real page content shown in by the browser.

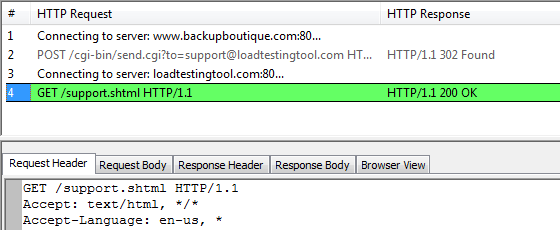
After we verify or run the test, we can check how the redirect is shown in the log:

Redirects in log

The original request is grayed out and the final redirected one is colored depending on the status code. You can select any of them and see the details in the view below. This works the same way as for any other request.

Posted in Testing practice | Tagged , , , , , | Leave a comment